Gene Information
|
Gene Name
|
KCNQ3 |
|
Gene ID
|
3786
|
|
Gene Full Name
|
potassium voltage-gated channel subfamily Q member 3 |
|
Gene Alias
|
BFNC2|EBN2|KV7.3 |
|
Transcripts
|
ENSG00000184156
|
|
Virus
|
HBV |
|
Gene Type
|
protein-coding |
|
HPA Location Info
|

|
|
Membrane Info
|
Disease related genes, Human disease related genes, Potential drug targets, Predicted membrane proteins, Transporters, Voltage-gated ion channels |
|
Uniport_ID
|
O43525
|
|
HGNC ID
|
HGNC:6297
|
|
OMIM ID
|
602232 |
|
Summary
|
This gene encodes a protein that functions in the regulation of neuronal excitability. The encoded protein forms an M-channel by associating with the products of the related KCNQ2 or KCNQ5 genes, which both encode integral membrane proteins. M-channel currents are inhibited by M1 muscarinic acetylcholine receptors and are activated by retigabine, a novel anti-convulsant drug. Defects in this gene are a cause of benign familial neonatal convulsions type 2 (BFNC2), also known as epilepsy, benign neonatal type 2 (EBN2). Alternative splicing of this gene results in multiple transcript variants. [provided by RefSeq, May 2014] |
Target gene [KCNQ3] related to VISs 
Integration Table: if previous studies reported that target gene was altered by virus integration events, the overlap between VISs in this literature and Cistrome factors was listed in this section
| DVID |
Chromosome |
HM |
TFBS |
CA |
Sum of Overlapped Records |
Detail |
| 1015471 |
chr8 |
1 |
1 |
0 |
2 |
View |
| 1019739 |
chr8 |
0 |
0 |
0 |
0 |
View |
| 1043413 |
chr8 |
7 |
1 |
0 |
8 |
View |
Target gene [KCNQ3] related to Omics data
| Data ID |
Experiment type |
Sample number |
Platform |
|
GSE236281
|
RNA-seq |
12 |
Illumina MiSeq (Homo sapiens) |
|
C GSE68402
|
Chip-seq |
26 |
Illumina MiSeq (Homo sapiens);Illumina HiSeq 2500 (Homo sapiens) |
|
TCGA_LIHC_HBV
|
DNA methylation sequencing;RNA-seq |
97 |
TCGA |
|
C GSE270130
|
Chip-seq |
27 |
Illumina NovaSeq 6000 (Homo sapiens) |
|
GSE224901
|
RNA-seq |
21 |
Illumina NovaSeq 6000 (Homo sapiens) |
|
GSE100400
|
Chip-seq;RNA-seq;4C_cccDNA |
31 |
Illumina NextSeq 500 (Homo sapiens);Illumina NextSeq 500 (Mus musculus) |
|
GSE173897
|
RNA-seq |
95 |
Illumina HiSeq 4000 (Homo sapiens) |
|
GSE262515
|
RNA-seq |
21 |
Illumina HiSeq 2500 (Homo sapiens);Illumina HiSeq 2500 (Mus musculus) |
|
GSE110345
|
RNA-seq |
4 |
Illumina HiSeq 2500 (Homo sapiens) |
|
C GSE131257
|
ATAC-seq;RNA-seq |
19 |
Illumina HiSeq 2500 (Homo sapiens) |
|
GSE94660
|
RNA-seq |
42 |
Illumina HiSeq 2500 (Homo sapiens) |
When the gene can detect a peak in the dataset, a peak plot will be displayed.
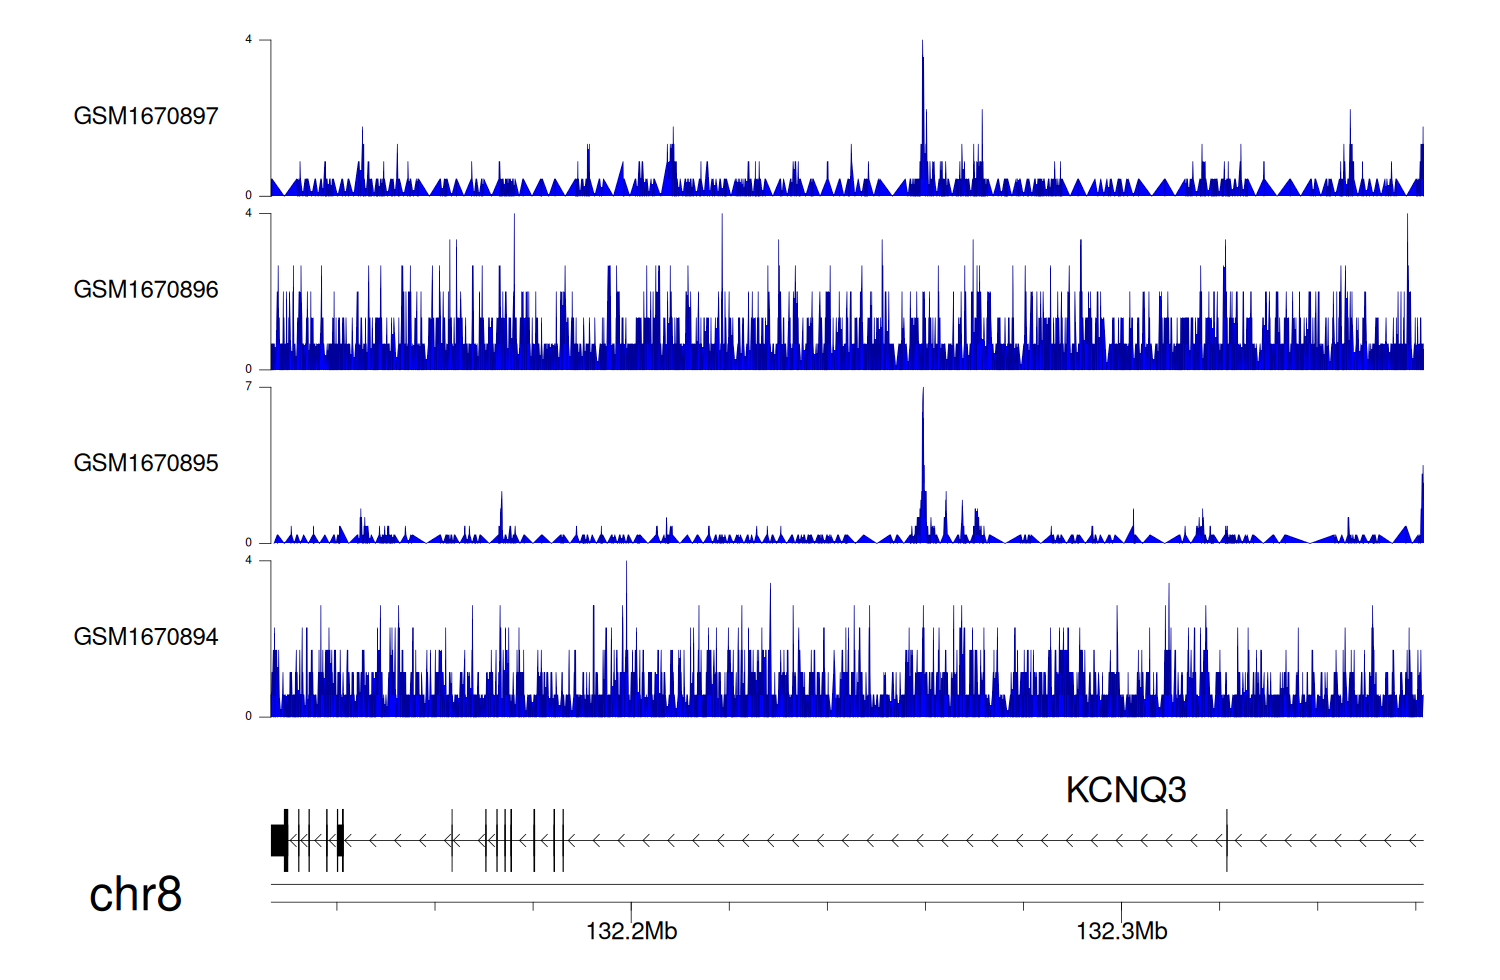
> Dataset: GSE68402 - KCNQ3 peak across samples
|
Peak Plot
|
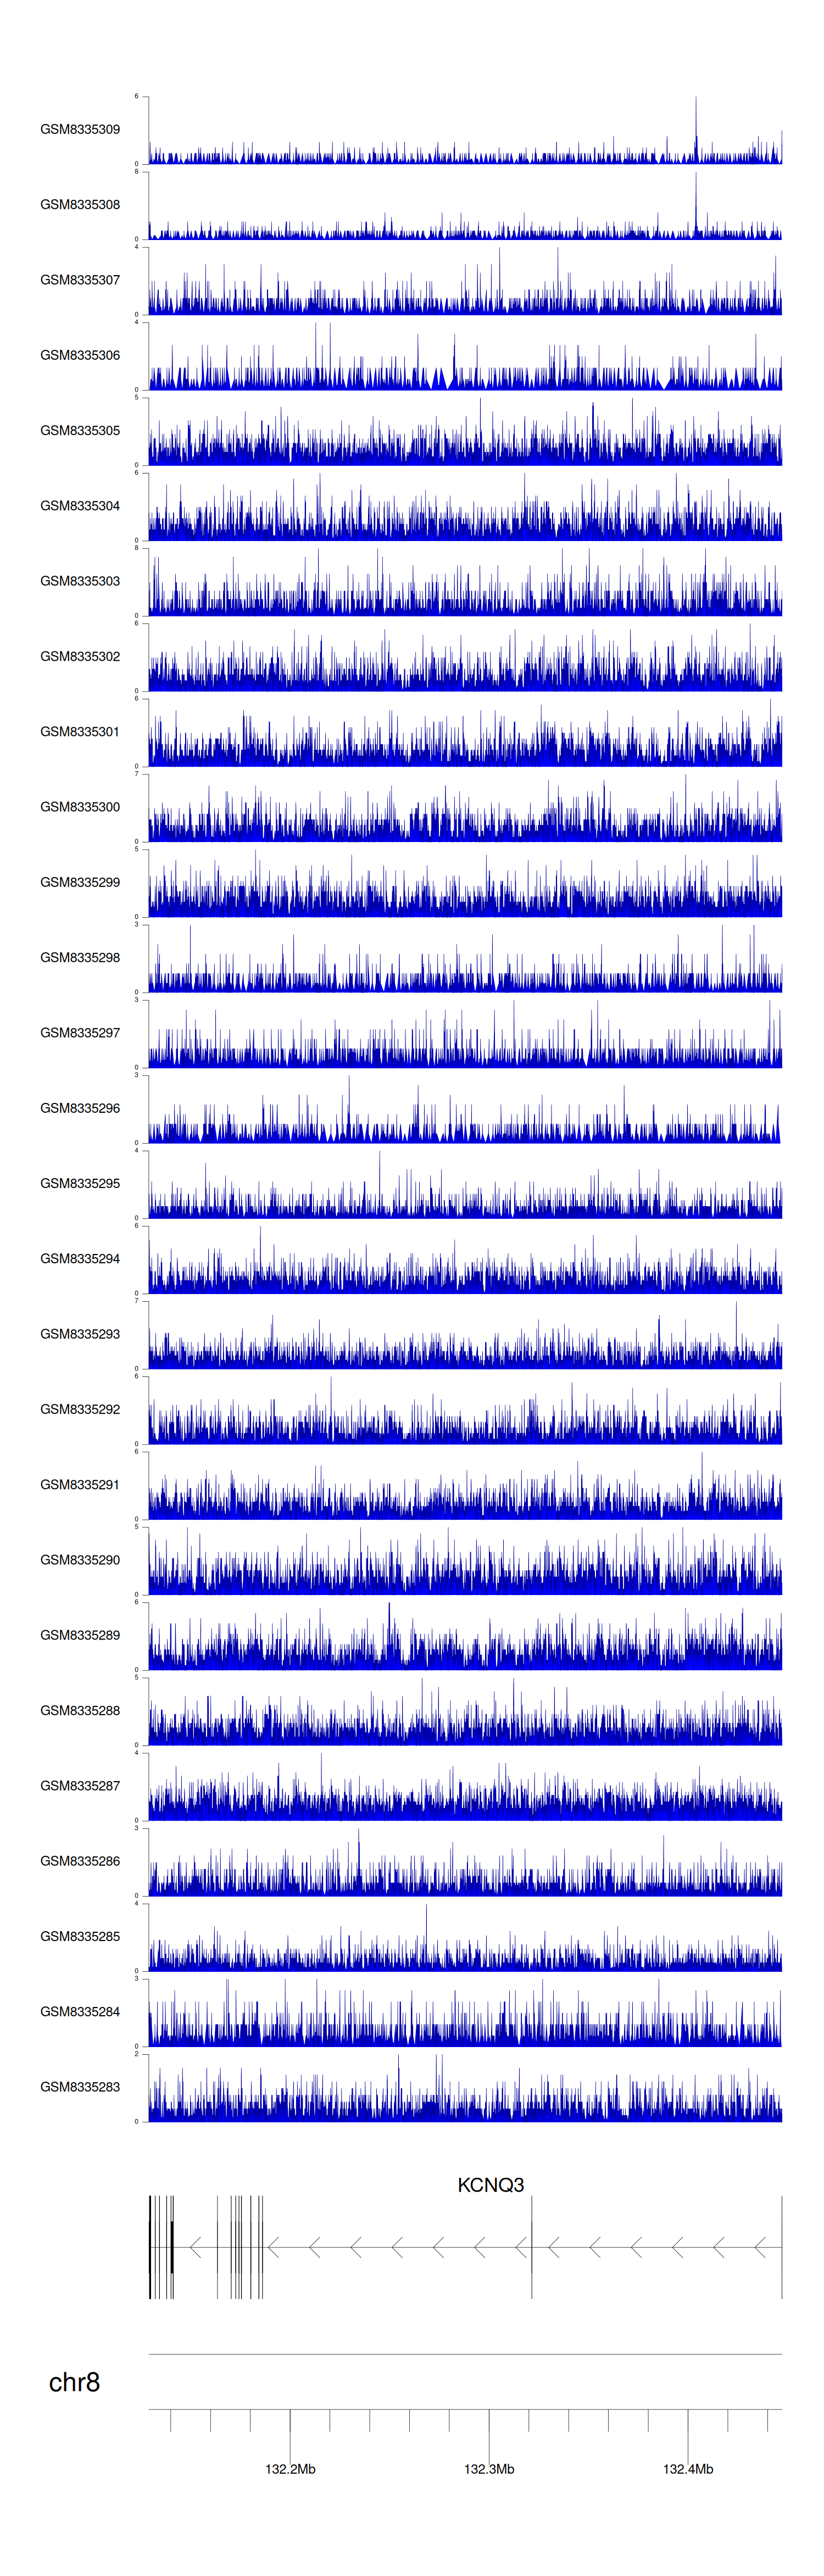
> Dataset: GSE270130 - KCNQ3 peak across samples
|
Peak Plot
|
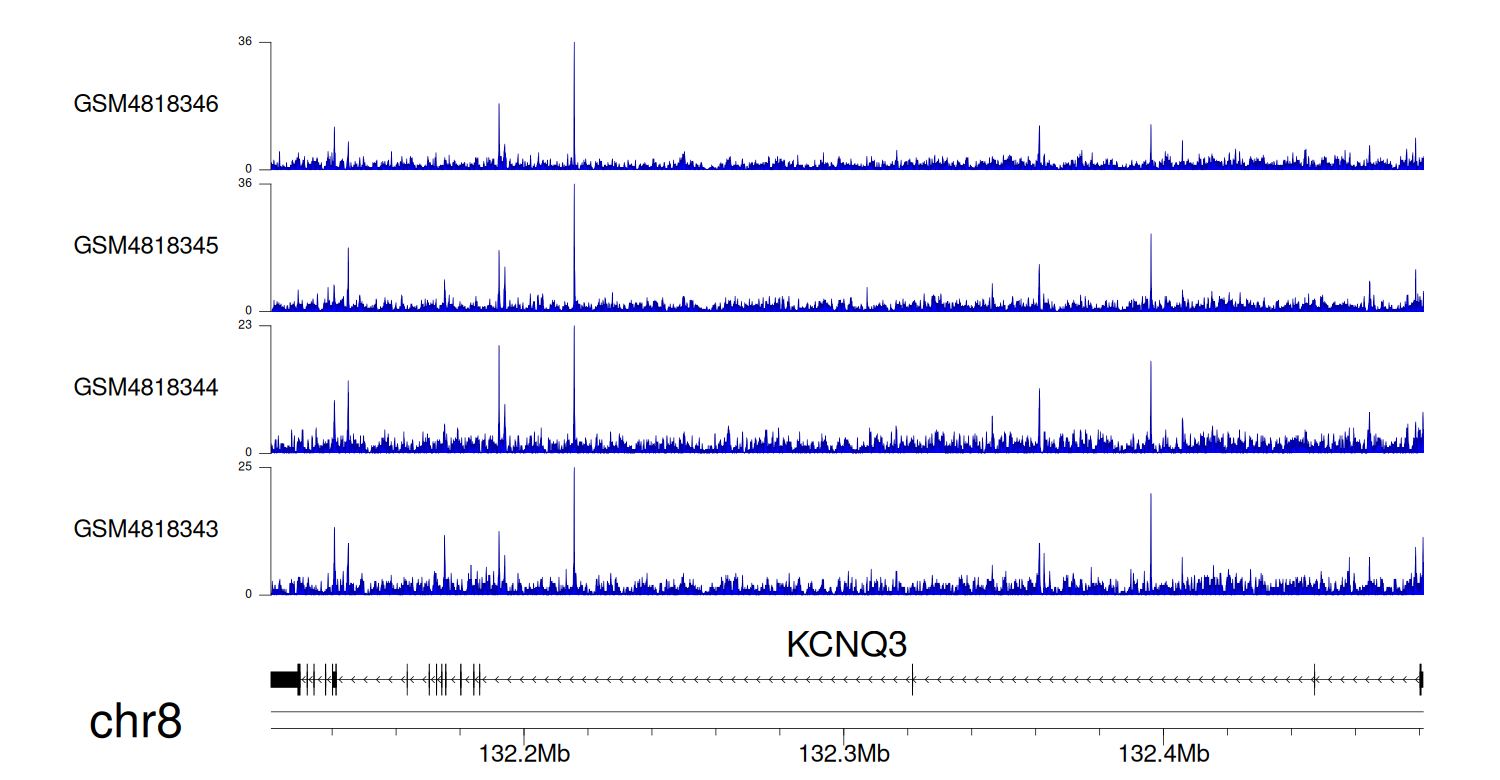
> Dataset: GSE131257 - KCNQ3 peak across samples
|
Peak Plot
|
|
|
