Gene Information
|
Gene Name
|
LINC01599 |
|
Gene ID
|
196913
|
|
Gene Full Name
|
long intergenic non-protein coding RNA 1599 |
|
Gene Alias
|
C14orf183 |
|
Transcripts
|
ENSG00000214900
|
|
Virus
|
HBV |
|
Gene Type
|
ncRNA |
|
HGNC ID
|
HGNC:27285
|
Target gene [LINC01599] related to VISs

Integration Table: if previous studies reported that target gene was altered by virus integration events, the overlap between VISs in this literature and Cistrome factors was listed in this section
| DVID |
Chromosome |
HM |
TFBS |
CA |
Sum of Overlapped Records |
Detail |
| 1002332 |
chr14 |
83 |
151 |
58 |
292 |
View |
| 1002602 |
chr14 |
83 |
119 |
37 |
239 |
View |
Target gene [LINC01599] related to Omics data
| Data ID |
Experiment type |
Sample number |
Platform |
|
C GSE35465
|
Chip-seq;RNA-seq |
6 |
Illumina HiSeq 2000 (Homo sapiens) |
|
C GSE68402
|
Chip-seq |
26 |
Illumina MiSeq (Homo sapiens);Illumina HiSeq 2500 (Homo sapiens) |
|
C GSE100400
|
Chip-seq;RNA-seq;4C_cccDNA |
31 |
Illumina NextSeq 500 (Homo sapiens);Illumina NextSeq 500 (Mus musculus) |
|
GSE262515
|
RNA-seq |
21 |
Illumina HiSeq 2500 (Homo sapiens);Illumina HiSeq 2500 (Mus musculus) |
|
C GSE131257
|
ATAC-seq;RNA-seq |
19 |
Illumina HiSeq 2500 (Homo sapiens) |
|
C GSE270130
|
Chip-seq |
27 |
Illumina NovaSeq 6000 (Homo sapiens) |
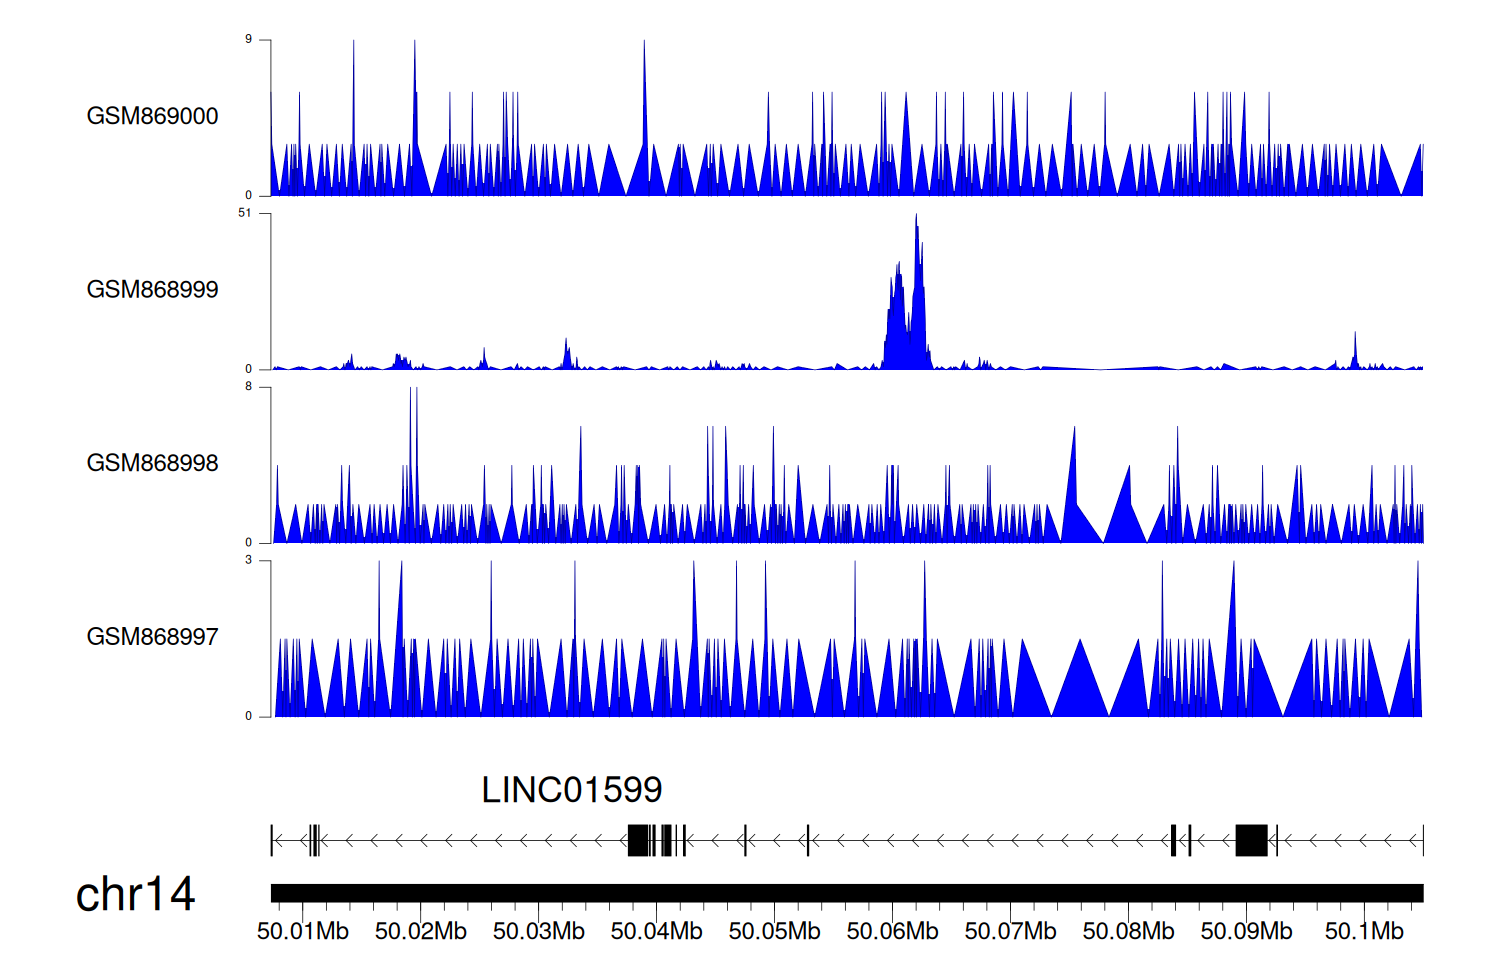
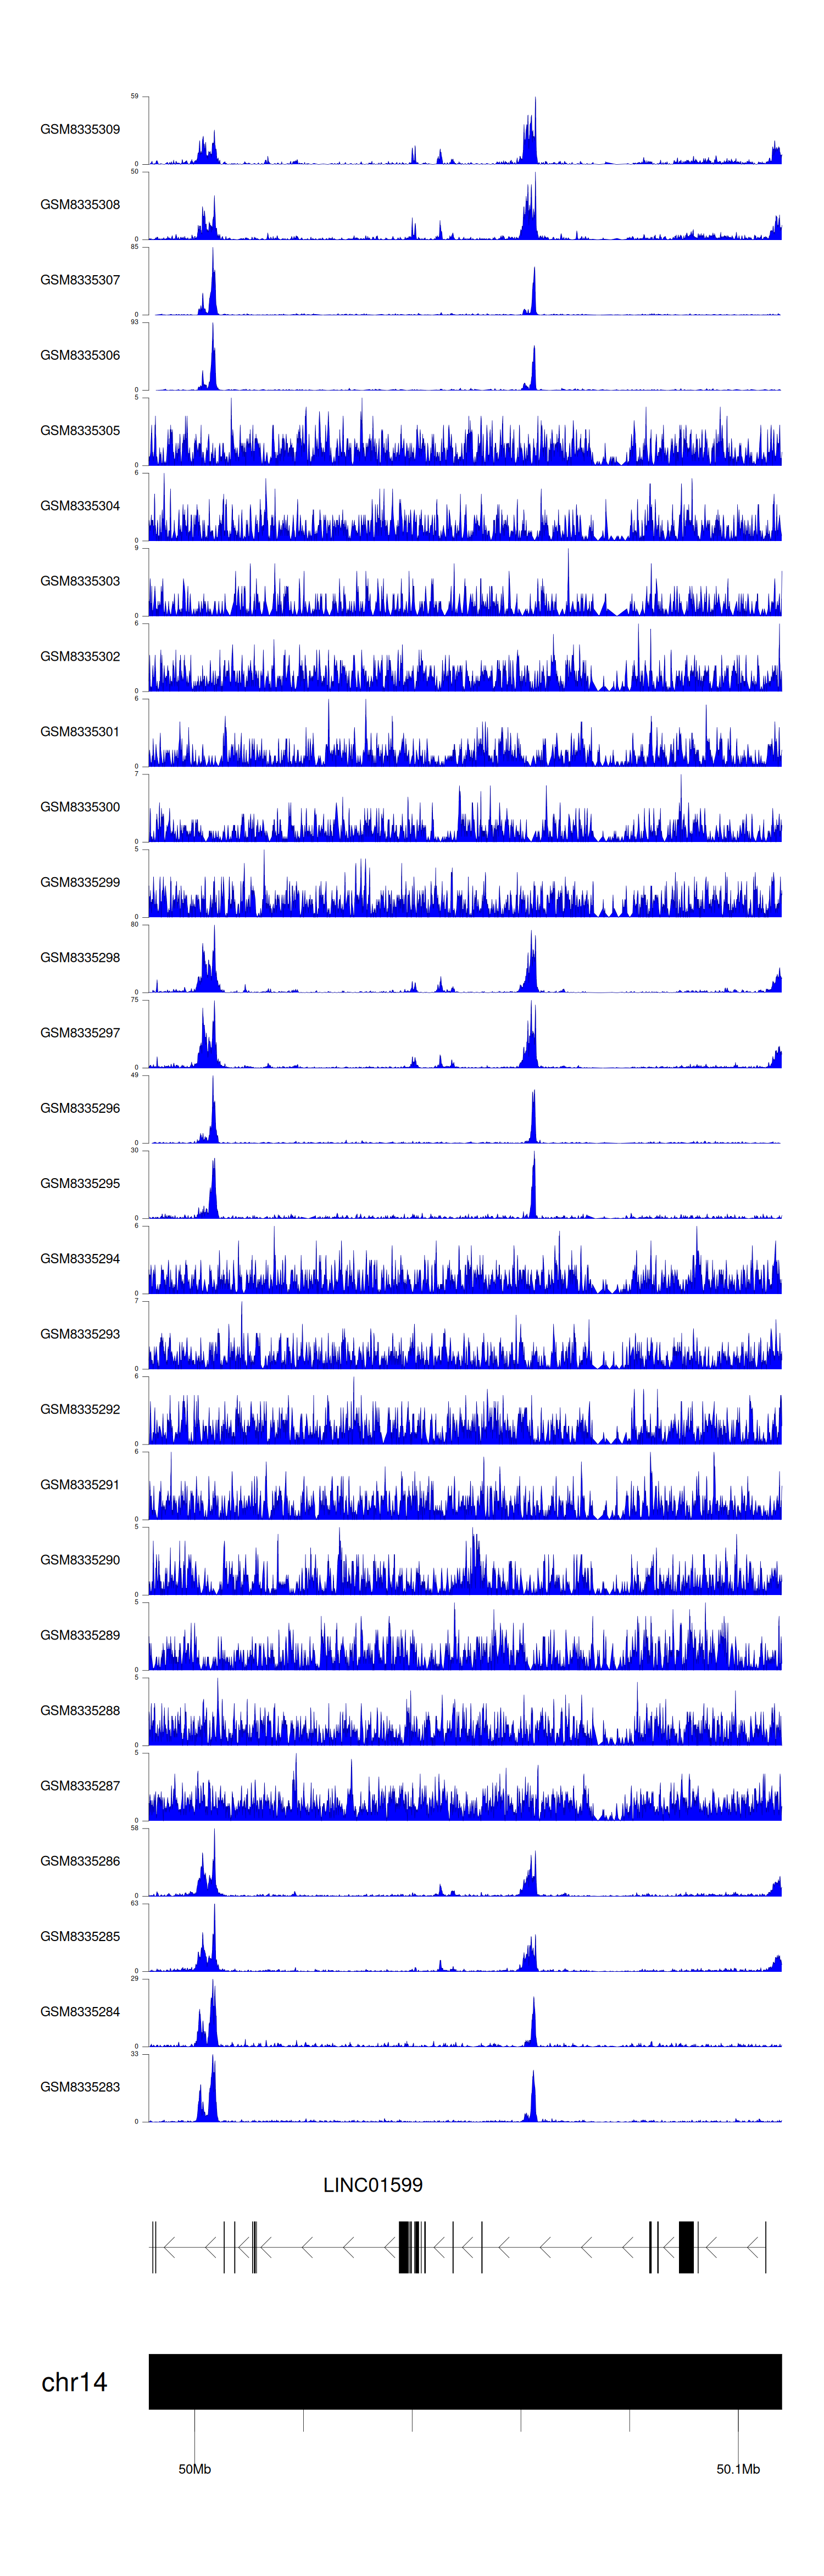
When the gene can detect a peak in the dataset, a peak plot will be displayed.
> Dataset: GSE35465 - LINC01599 peak across samples
|
Peak Plot
|
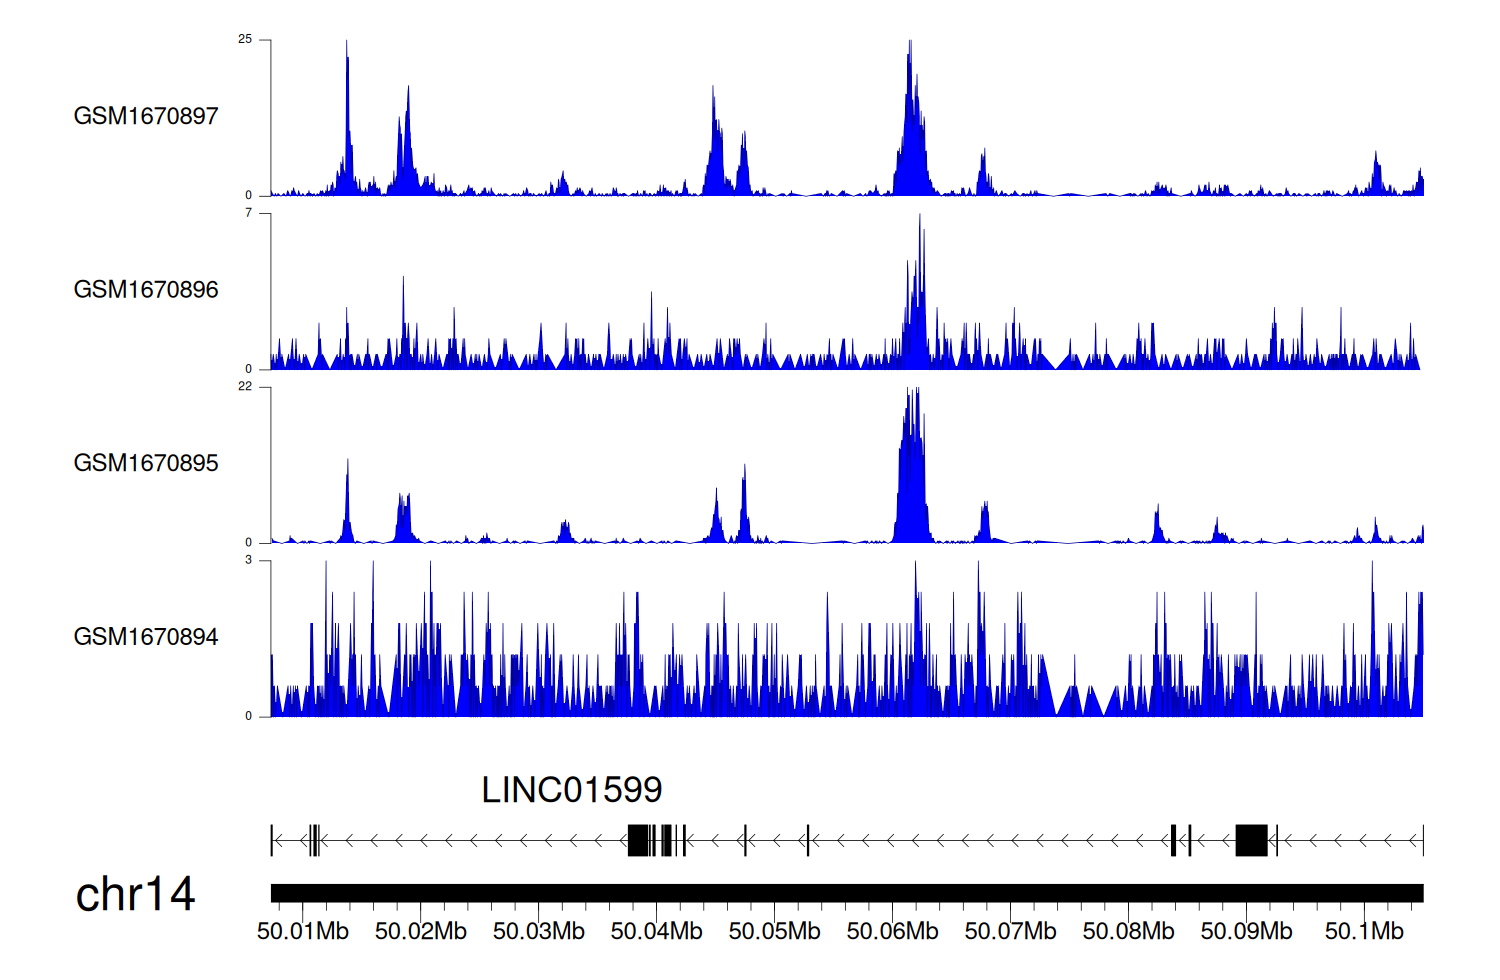
> Dataset: GSE68402 - LINC01599 peak across samples
|
Peak Plot
|
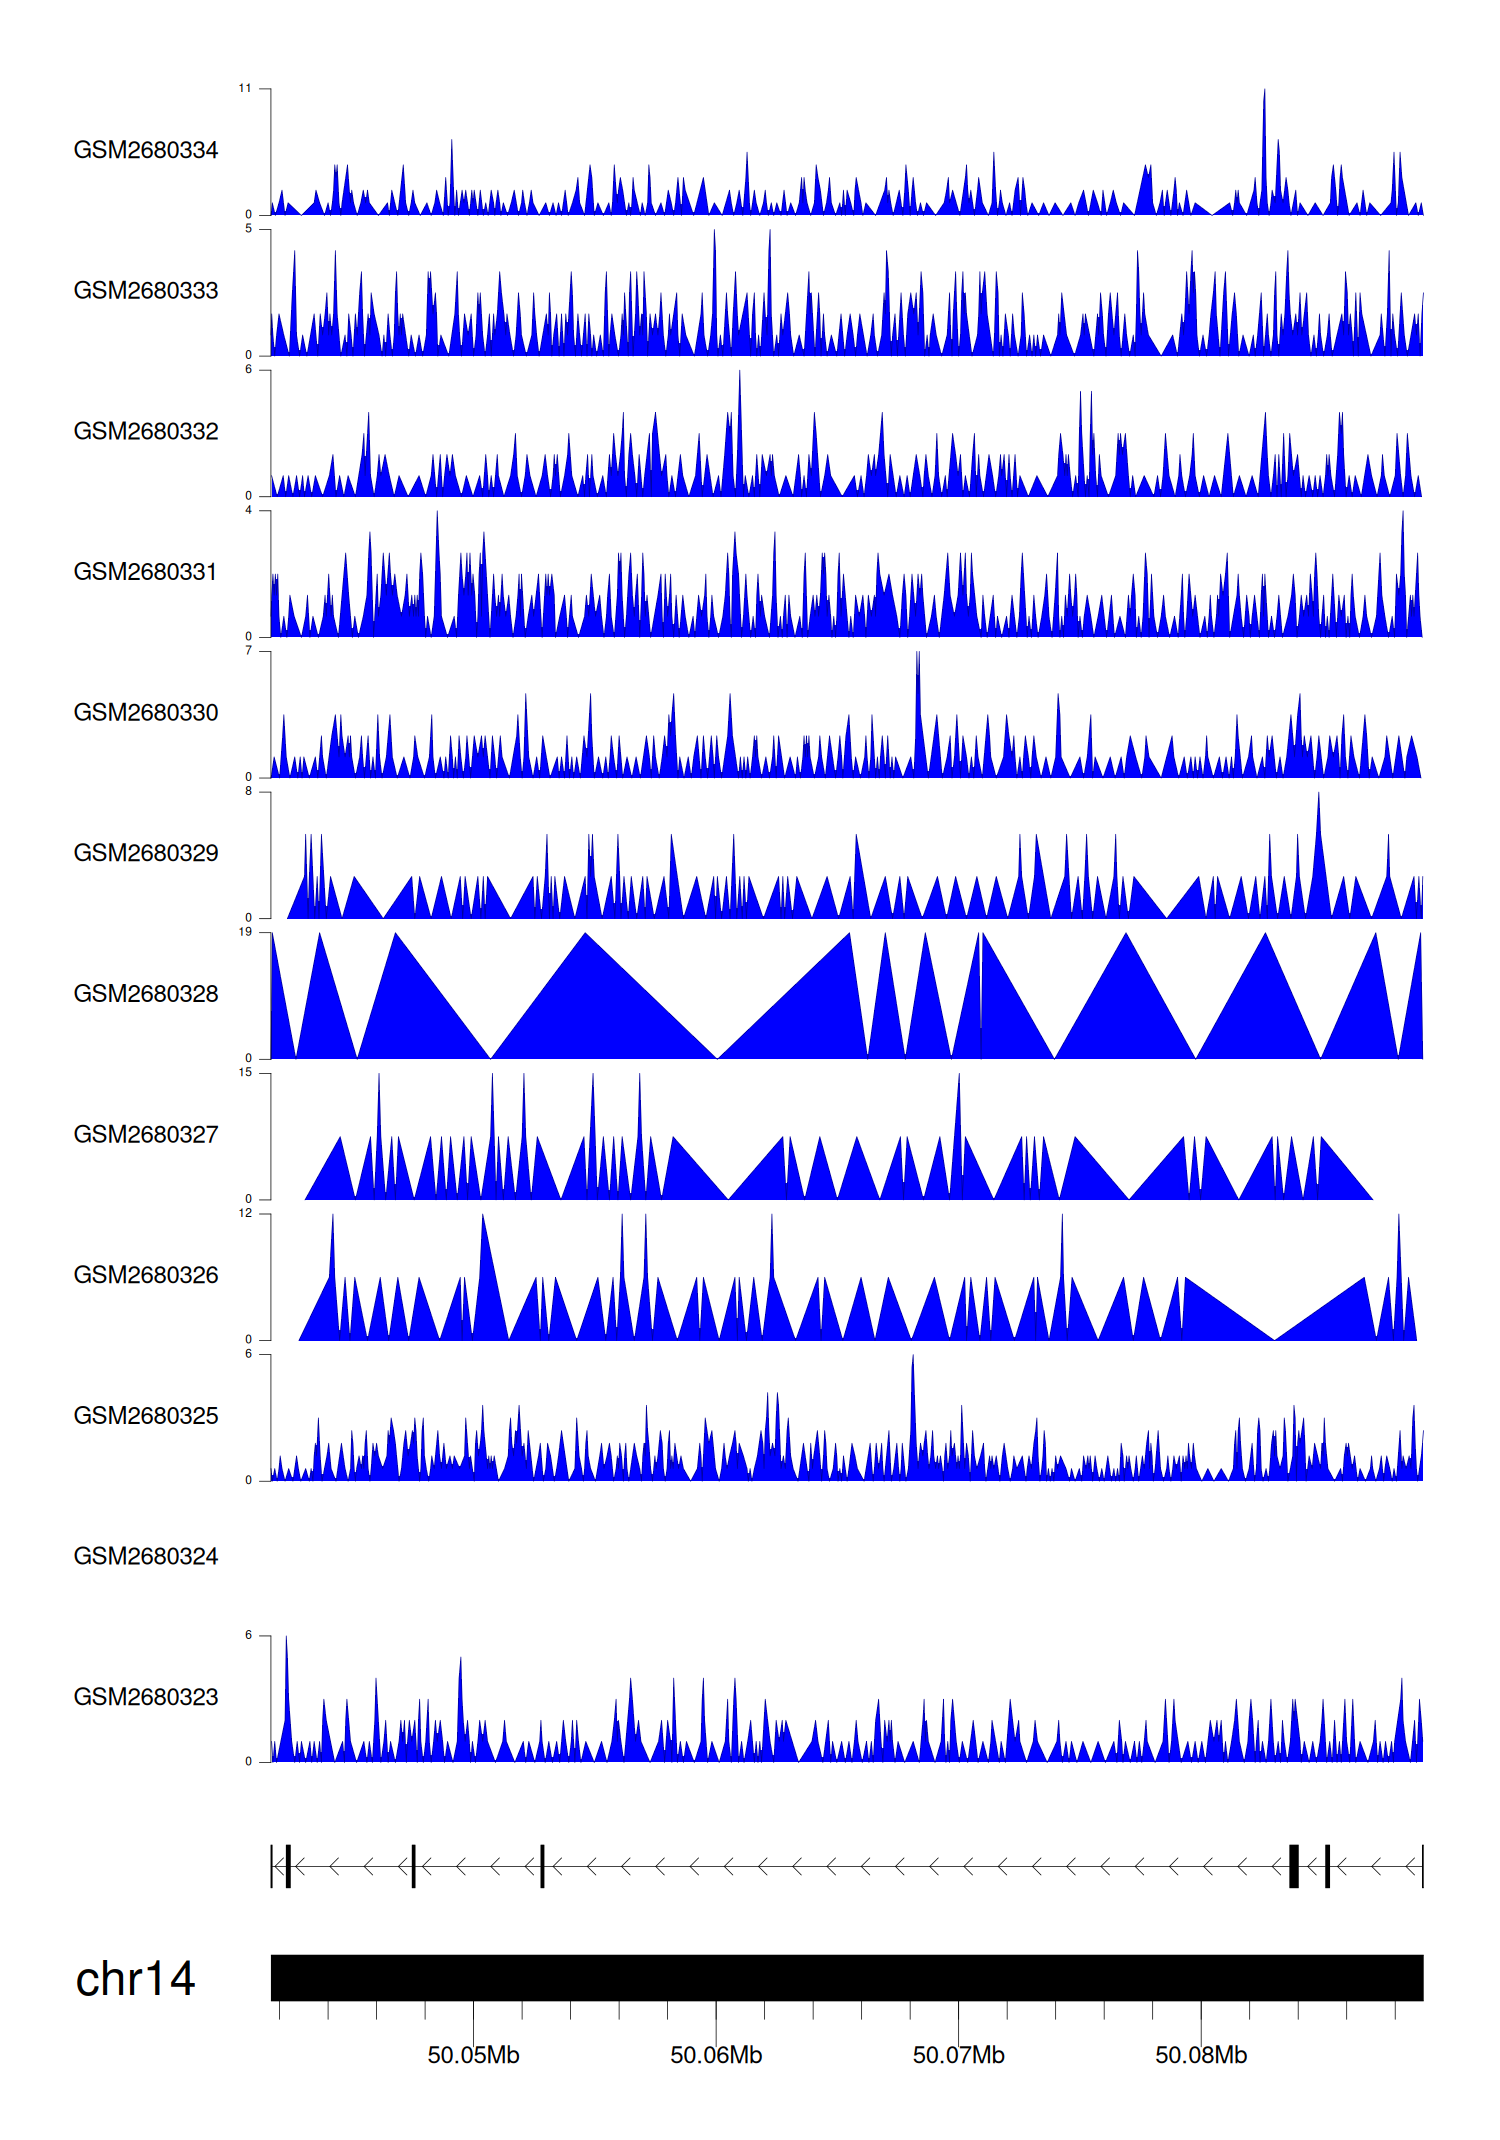
> Dataset: GSE100400 - LINC01599 peak across samples
|
Peak Plot
|
> Dataset: GSE131257 - LINC01599 peak across samples
|
Peak Plot
|
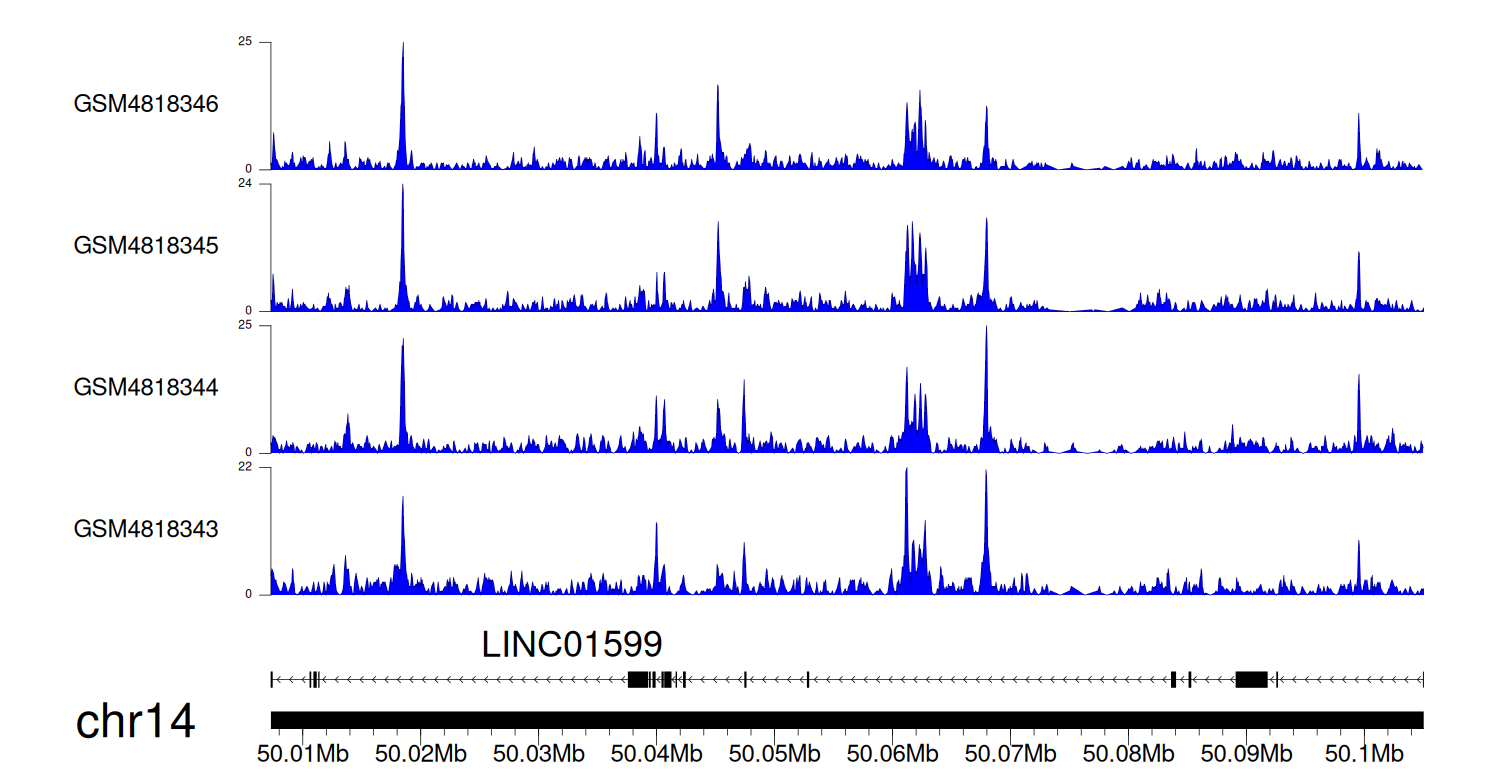
> Dataset: GSE270130 - LINC01599 peak across samples
|
Peak Plot
|
