Gene Information
|
Gene Name
|
LSS |
|
Gene ID
|
4047
|
|
Gene Full Name
|
lanosterol synthase |
|
Gene Alias
|
APMR4|CTRCT44|HYPT14|OSC |
|
Transcripts
|
ENSG00000160285
|
|
Virus
|
HBV |
|
Gene Type
|
protein-coding |
|
HPA Location Info
|

|
|
Membrane Info
|
Disease related genes, Enzymes, Human disease related genes, Metabolic proteins, Potential drug targets, Predicted intracellular proteins |
|
Uniport_ID
|
P48449
|
|
HGNC ID
|
HGNC:6708
|
|
OMIM ID
|
600909 |
|
Summary
|
The protein encoded by this gene catalyzes the conversion of (S)-2,3 oxidosqualene to lanosterol. The encoded protein is a member of the terpene cyclase/mutase family and catalyzes the first step in the biosynthesis of cholesterol, steroid hormones, and vitamin D. Alternative splicing results in multiple transcript variants encoding different isoforms.[provided by RefSeq, Feb 2009] |
Target gene [LSS] related to VISs 
Integration Table: if previous studies reported that target gene was altered by virus integration events, the overlap between VISs in this literature and Cistrome factors was listed in this section
Target gene [LSS] related to Omics data
| Data ID |
Experiment type |
Sample number |
Platform |
|
GSE236281
|
RNA-seq |
12 |
Illumina MiSeq (Homo sapiens) |
|
C GSE68402
|
Chip-seq |
26 |
Illumina MiSeq (Homo sapiens);Illumina HiSeq 2500 (Homo sapiens) |
|
TCGA_LIHC_HBV
|
DNA methylation sequencing;RNA-seq |
97 |
TCGA |
|
C GSE270130
|
Chip-seq |
27 |
Illumina NovaSeq 6000 (Homo sapiens) |
|
GSE224901
|
RNA-seq |
21 |
Illumina NovaSeq 6000 (Homo sapiens) |
|
GSE100400
|
Chip-seq;RNA-seq;4C_cccDNA |
31 |
Illumina NextSeq 500 (Homo sapiens);Illumina NextSeq 500 (Mus musculus) |
|
GSE173897
|
RNA-seq |
95 |
Illumina HiSeq 4000 (Homo sapiens) |
|
GSE262515
|
RNA-seq |
21 |
Illumina HiSeq 2500 (Homo sapiens);Illumina HiSeq 2500 (Mus musculus) |
|
GSE110345
|
RNA-seq |
4 |
Illumina HiSeq 2500 (Homo sapiens) |
|
C GSE131257
|
ATAC-seq;RNA-seq |
19 |
Illumina HiSeq 2500 (Homo sapiens) |
|
GSE94660
|
RNA-seq |
42 |
Illumina HiSeq 2500 (Homo sapiens) |
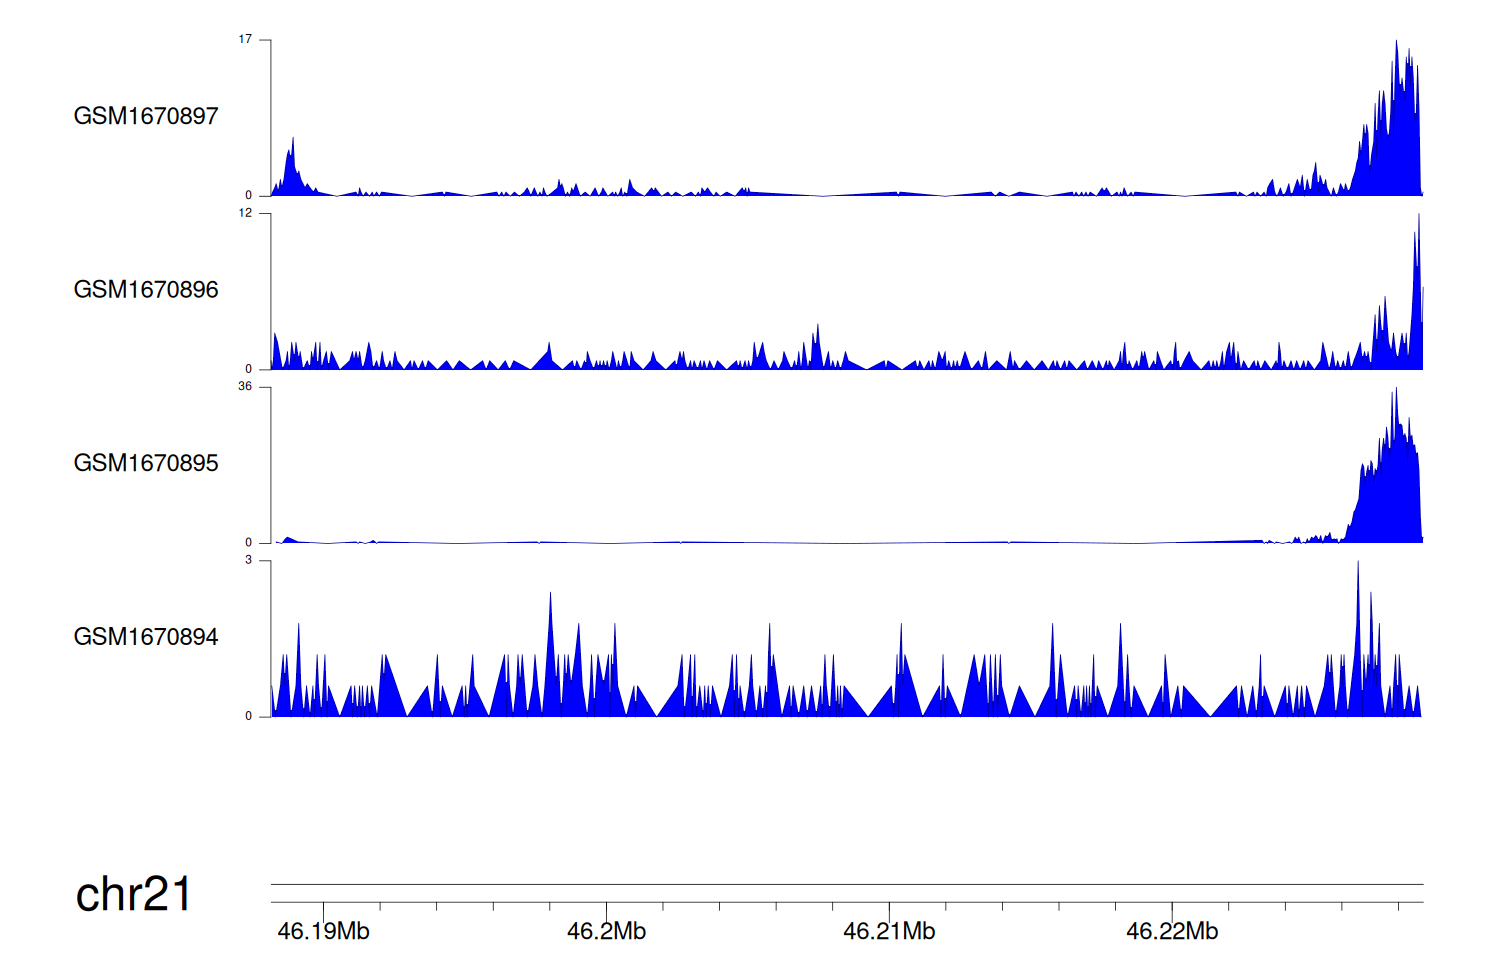
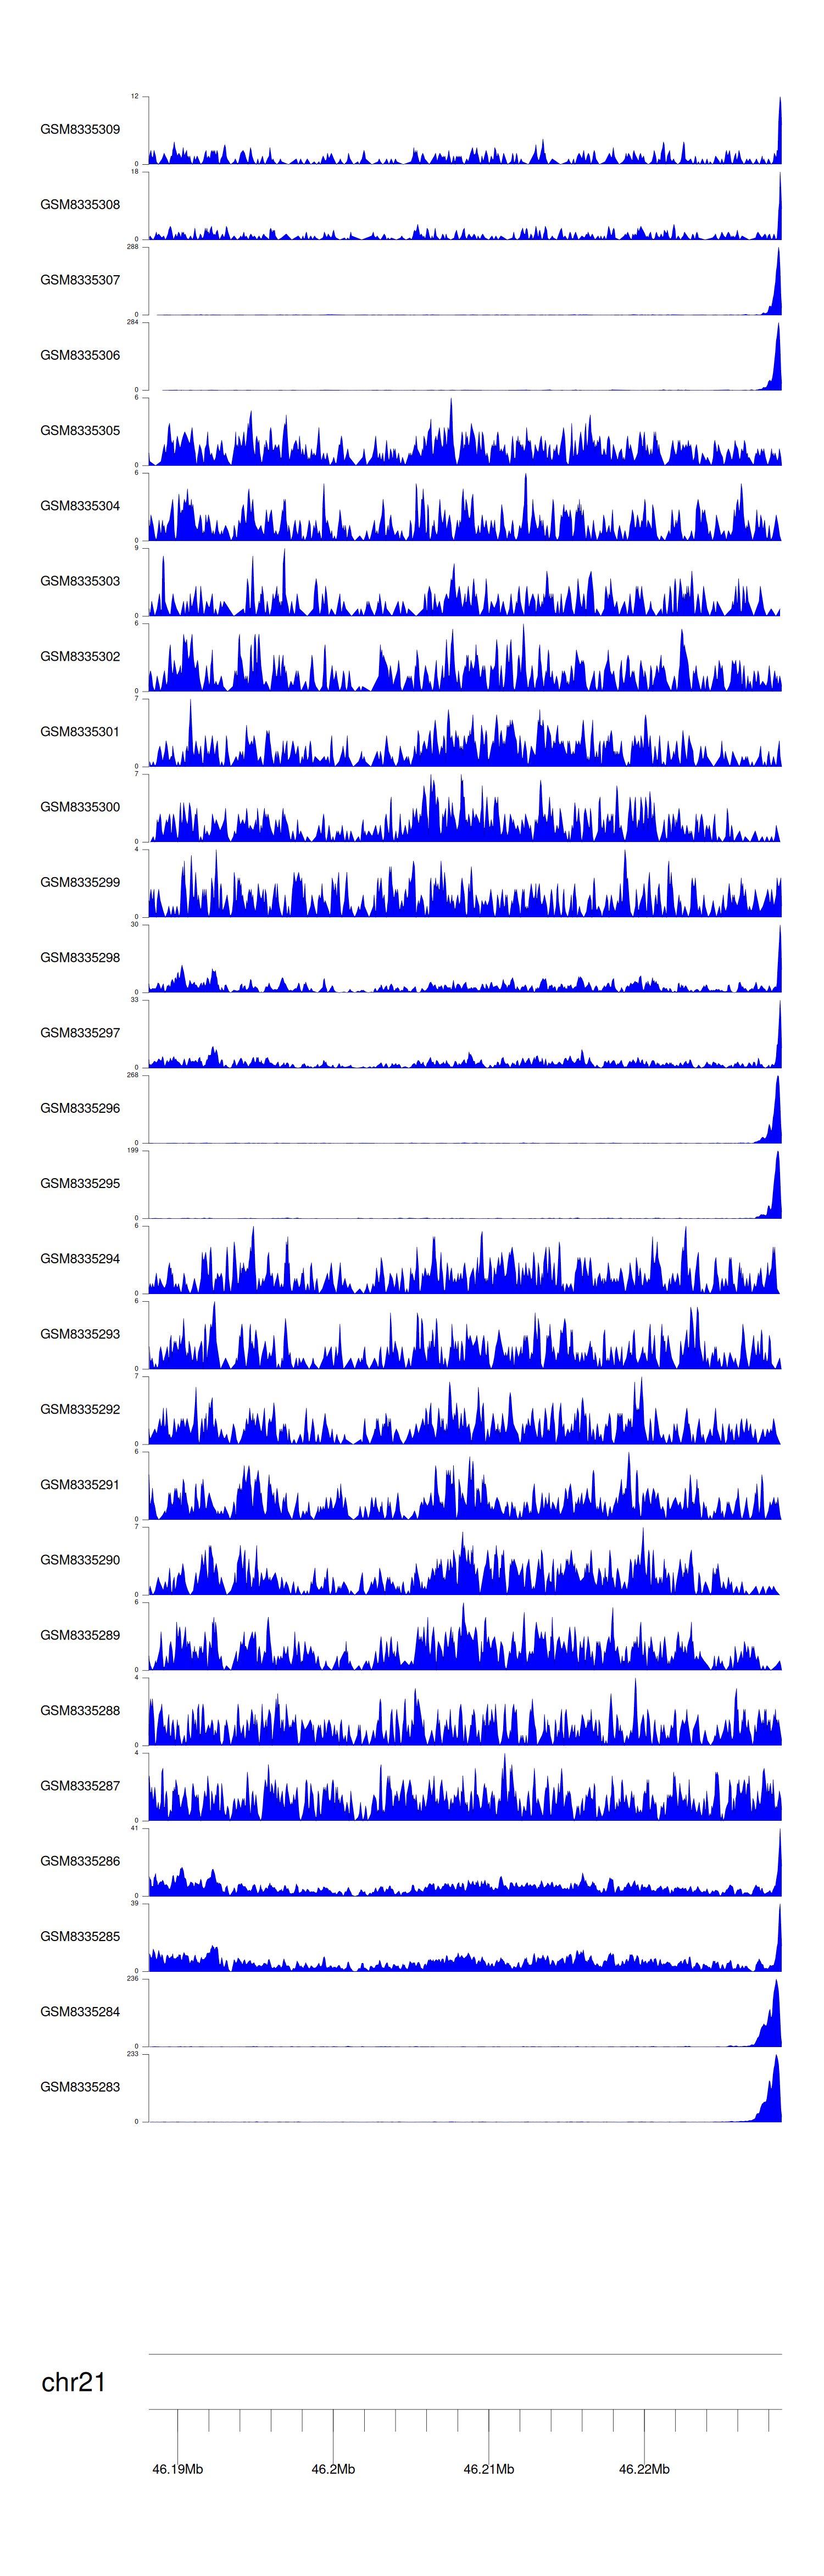
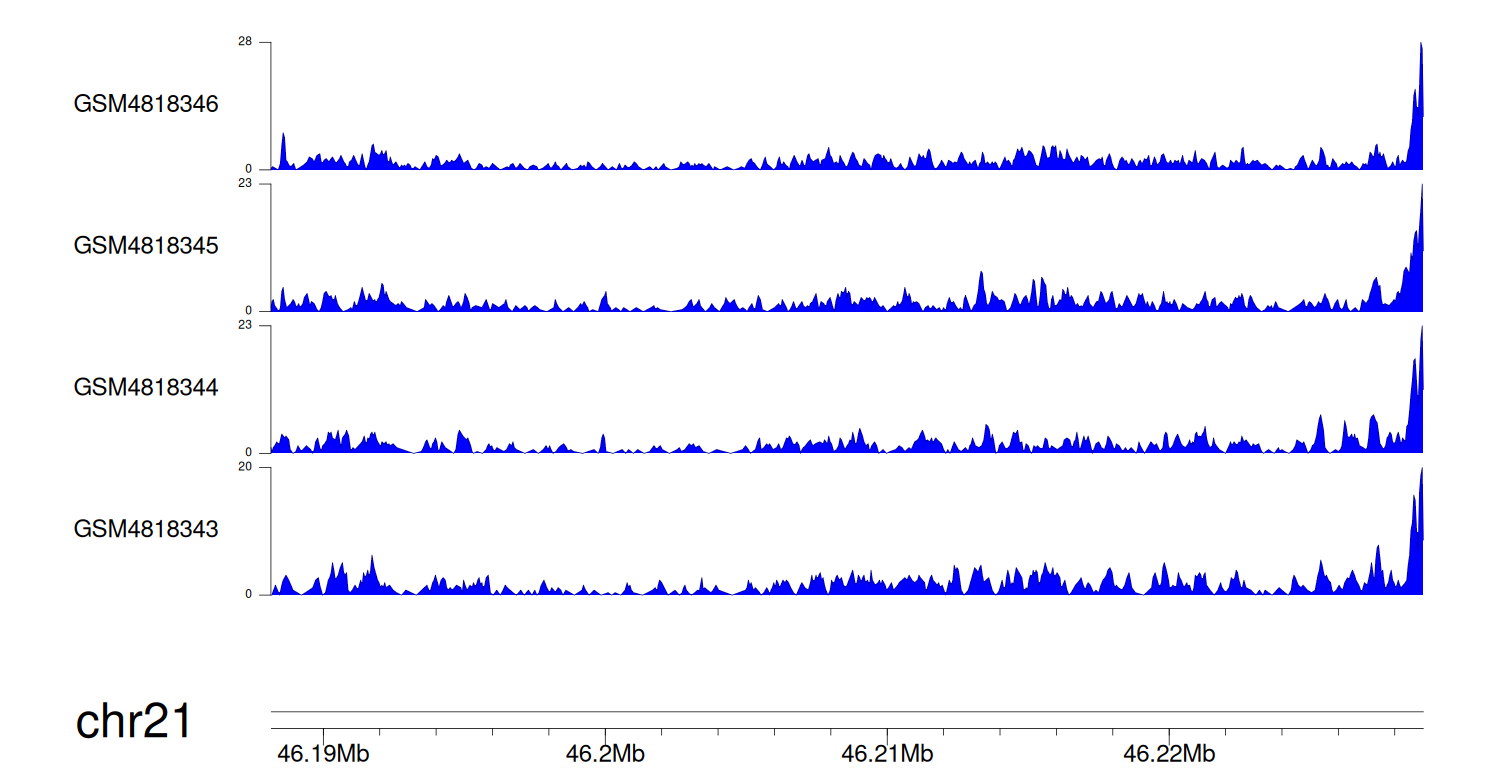
When the gene can detect a peak in the dataset, a peak plot will be displayed.
> Dataset: GSE68402 - LSS peak across samples
|
Peak Plot
|
> Dataset: GSE270130 - LSS peak across samples
|
Peak Plot
|
> Dataset: GSE131257 - LSS peak across samples
|
Peak Plot
|
|
|
