Gene Information
|
Gene Name
|
MAPK10 |
|
Gene ID
|
5602
|
|
Gene Full Name
|
mitogen-activated protein kinase 10 |
|
Gene Alias
|
JNK3|JNK3A|PRKM10|SAPK1b|p493F12|p54bSAPK |
|
Transcripts
|
ENSG00000109339
|
|
Virus
|
HBV |
|
Gene Type
|
protein-coding |
|
HPA Location Info
|
Nucleoplasm; 
|
|
Membrane Info
|
Disease related genes, Enzymes, Human disease related genes, Potential drug targets, Predicted intracellular proteins, RAS pathway related proteins |
|
Uniport_ID
|
P53779
|
|
HGNC ID
|
HGNC:6872
|
|
OMIM ID
|
602897 |
|
Summary
|
The protein encoded by this gene is a member of the MAP kinase family. MAP kinases act as integration points for multiple biochemical signals, and thus are involved in a wide variety of cellular processes, such as proliferation, differentiation, transcription regulation and development. This kinase is specifically expressed in a subset of neurons in the nervous system, and is activated by threonine and tyrosine phosphorylation. Targeted deletion of this gene in mice suggests that it may have a role in stress-induced neuronal apoptosis. Alternatively spliced transcript variants encoding different isoforms have been described for this gene. A recent study provided evidence for translational readthrough in this gene, and expression of an additional C-terminally extended isoform via the use of an alternative in-frame translation termination codon. [provided by RefSeq, Dec 2017] |
Target gene [MAPK10] related to VISs 
Integration Table: if previous studies reported that target gene was altered by virus integration events, the overlap between VISs in this literature and Cistrome factors was listed in this section
| DVID |
Chromosome |
HM |
TFBS |
CA |
Sum of Overlapped Records |
Detail |
| 1009837 |
chr4 |
12 |
2 |
0 |
14 |
View |
| 1018600 |
chr4 |
0 |
0 |
0 |
0 |
View |
| 1042860 |
chr4 |
6 |
1 |
1 |
8 |
View |
Target gene [MAPK10] related to Omics data
| Data ID |
Experiment type |
Sample number |
Platform |
|
GSE236281
|
RNA-seq |
12 |
Illumina MiSeq (Homo sapiens) |
|
C GSE35465
|
Chip-seq;RNA-seq |
6 |
Illumina HiSeq 2000 (Homo sapiens) |
|
GSE199850
|
scRNA-seq |
1 |
HiSeq X Ten (Homo sapiens) |
|
C GSE68402
|
Chip-seq |
26 |
Illumina MiSeq (Homo sapiens);Illumina HiSeq 2500 (Homo sapiens) |
|
TCGA_LIHC_HBV
|
DNA methylation sequencing;RNA-seq |
97 |
TCGA |
|
C GSE270130
|
Chip-seq |
27 |
Illumina NovaSeq 6000 (Homo sapiens) |
|
GSE224901
|
RNA-seq |
21 |
Illumina NovaSeq 6000 (Homo sapiens) |
|
C GSE100400
|
Chip-seq;RNA-seq;4C_cccDNA |
31 |
Illumina NextSeq 500 (Homo sapiens);Illumina NextSeq 500 (Mus musculus) |
|
GSE173897
|
RNA-seq |
95 |
Illumina HiSeq 4000 (Homo sapiens) |
|
GSE262515
|
RNA-seq |
21 |
Illumina HiSeq 2500 (Homo sapiens);Illumina HiSeq 2500 (Mus musculus) |
|
GSE110345
|
RNA-seq |
4 |
Illumina HiSeq 2500 (Homo sapiens) |
|
C GSE131257
|
ATAC-seq;RNA-seq |
19 |
Illumina HiSeq 2500 (Homo sapiens) |
|
GSE94660
|
RNA-seq |
42 |
Illumina HiSeq 2500 (Homo sapiens) |
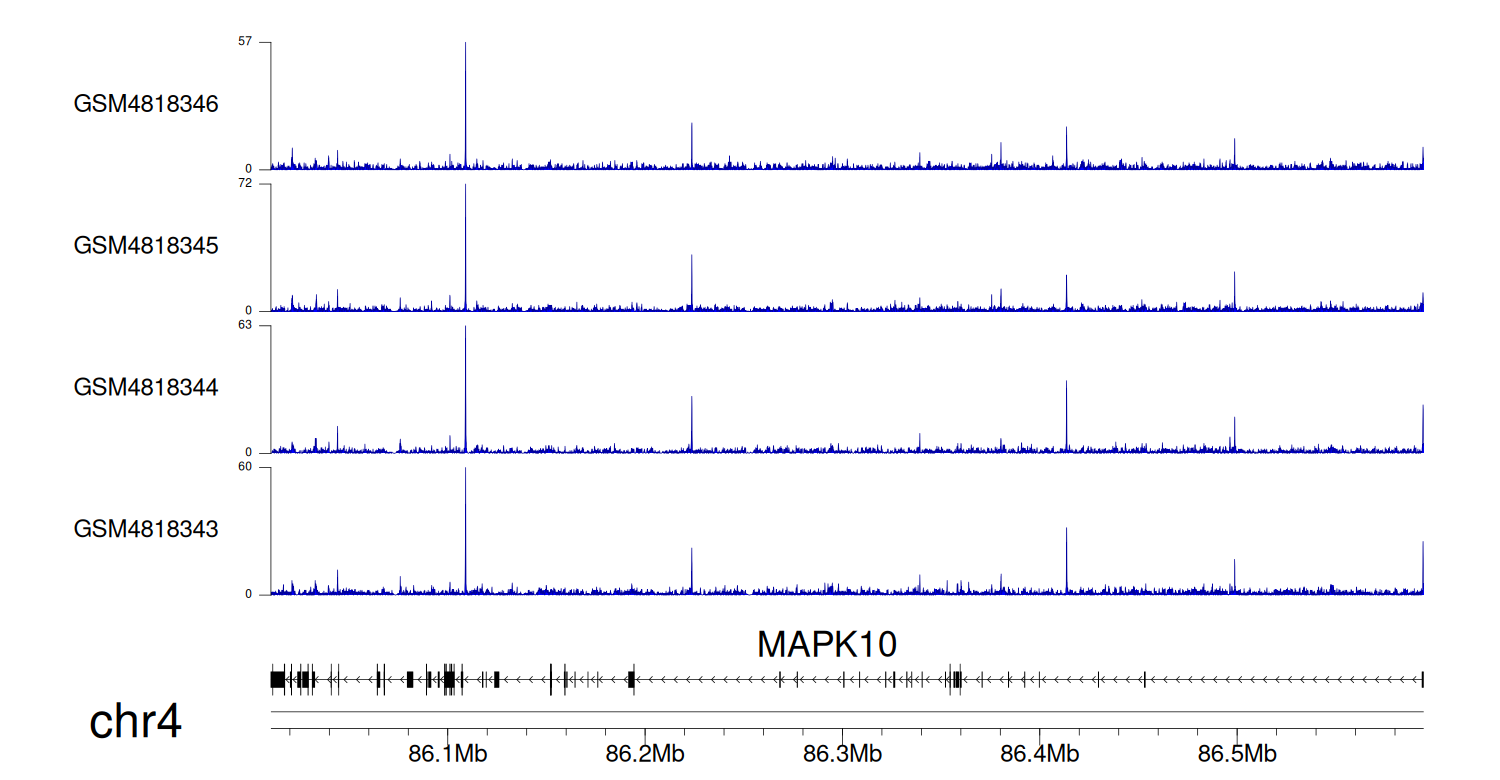
When the gene can detect a peak in the dataset, a peak plot will be displayed.
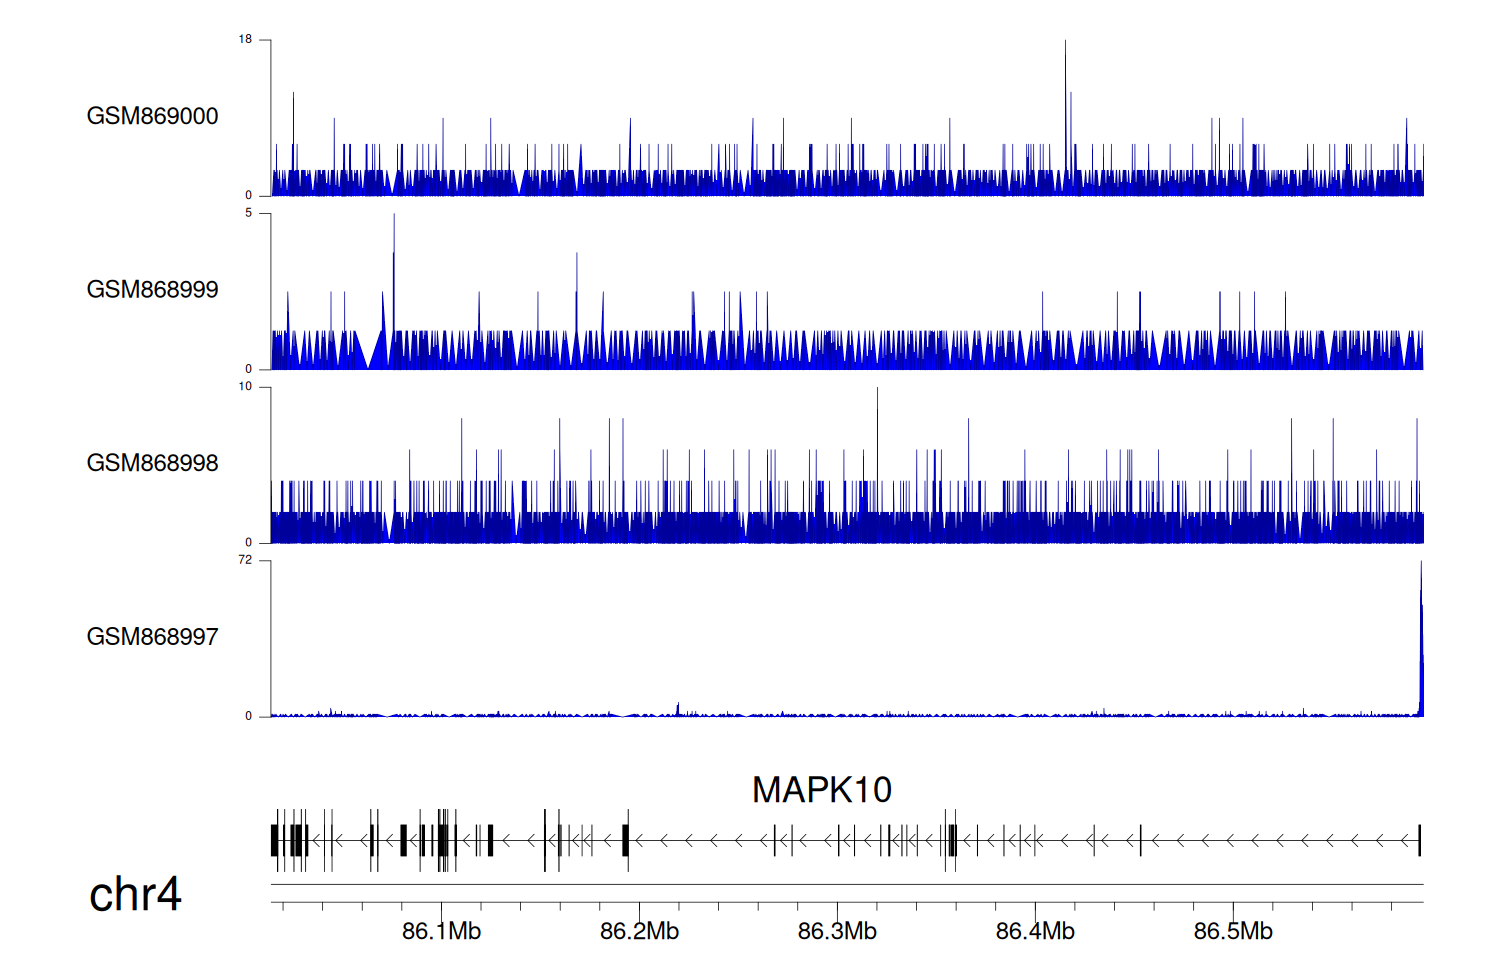
> Dataset: GSE35465 - MAPK10 peak across samples
|
Peak Plot
|
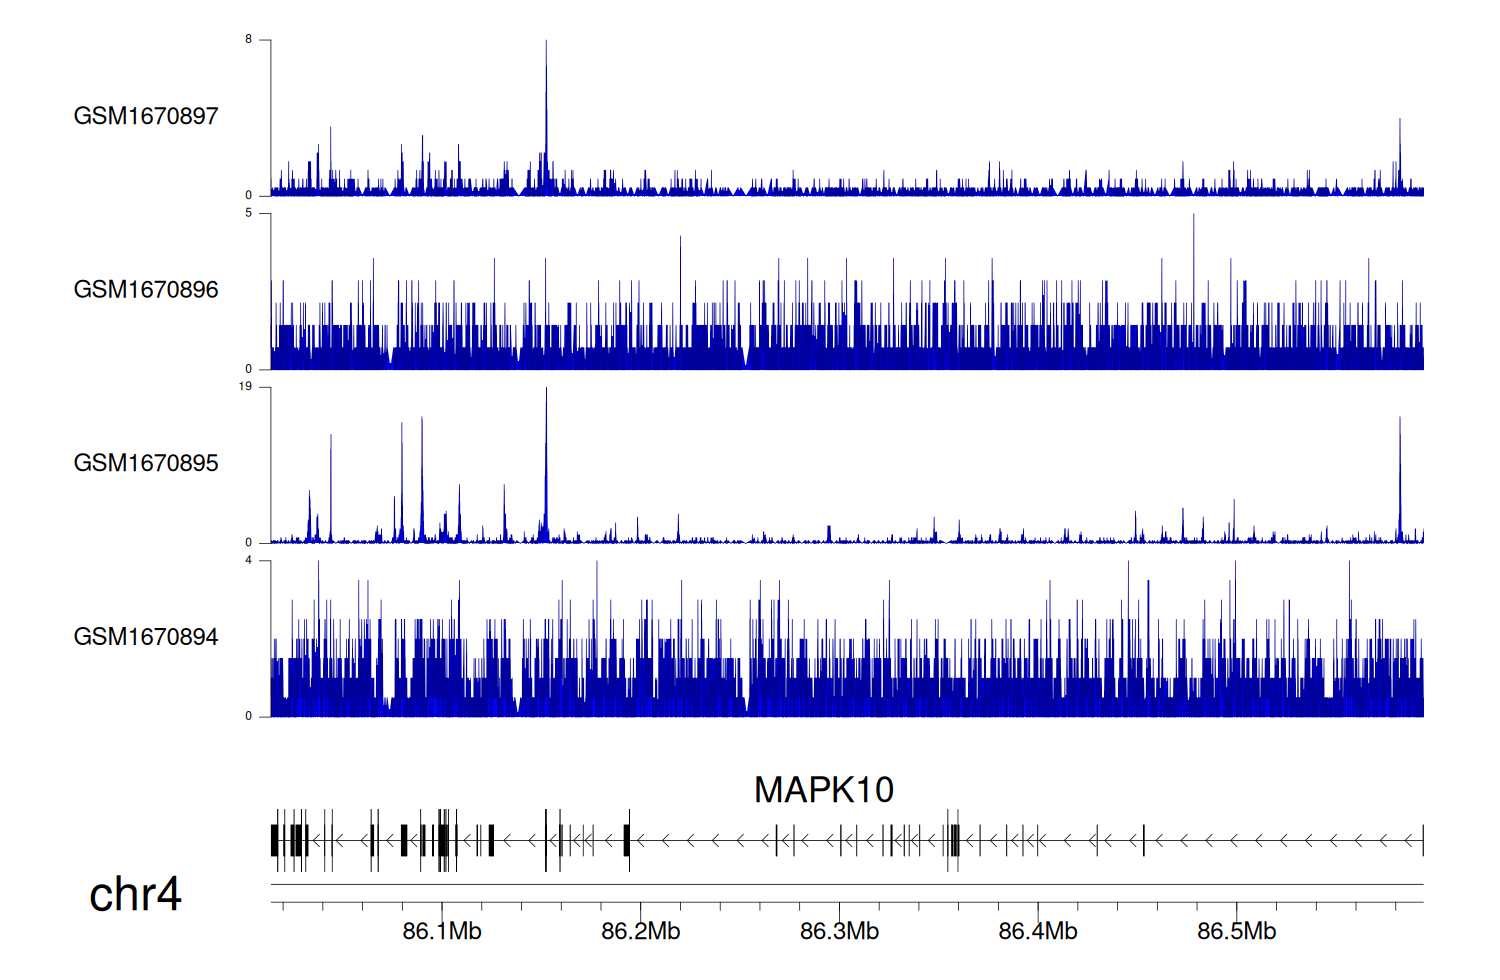
> Dataset: GSE68402 - MAPK10 peak across samples
|
Peak Plot
|
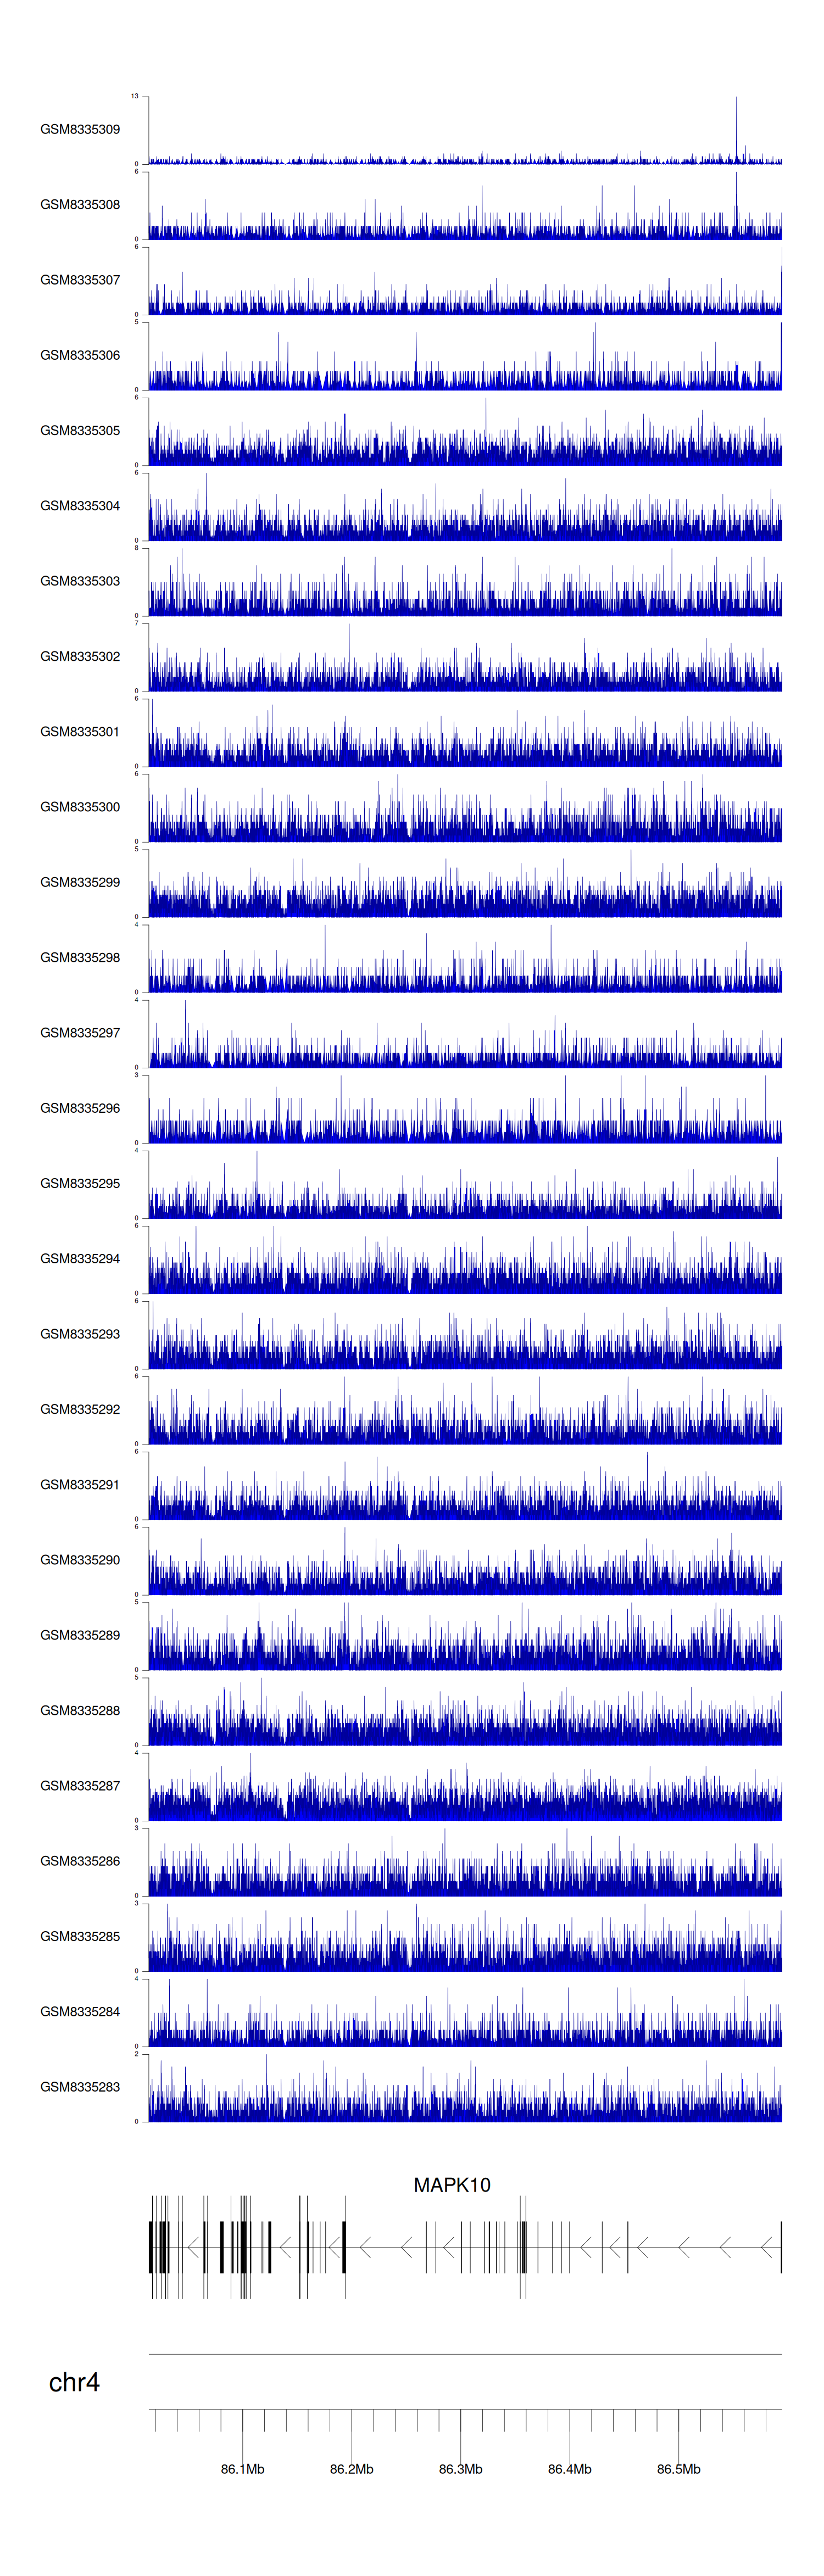
> Dataset: GSE270130 - MAPK10 peak across samples
|
Peak Plot
|
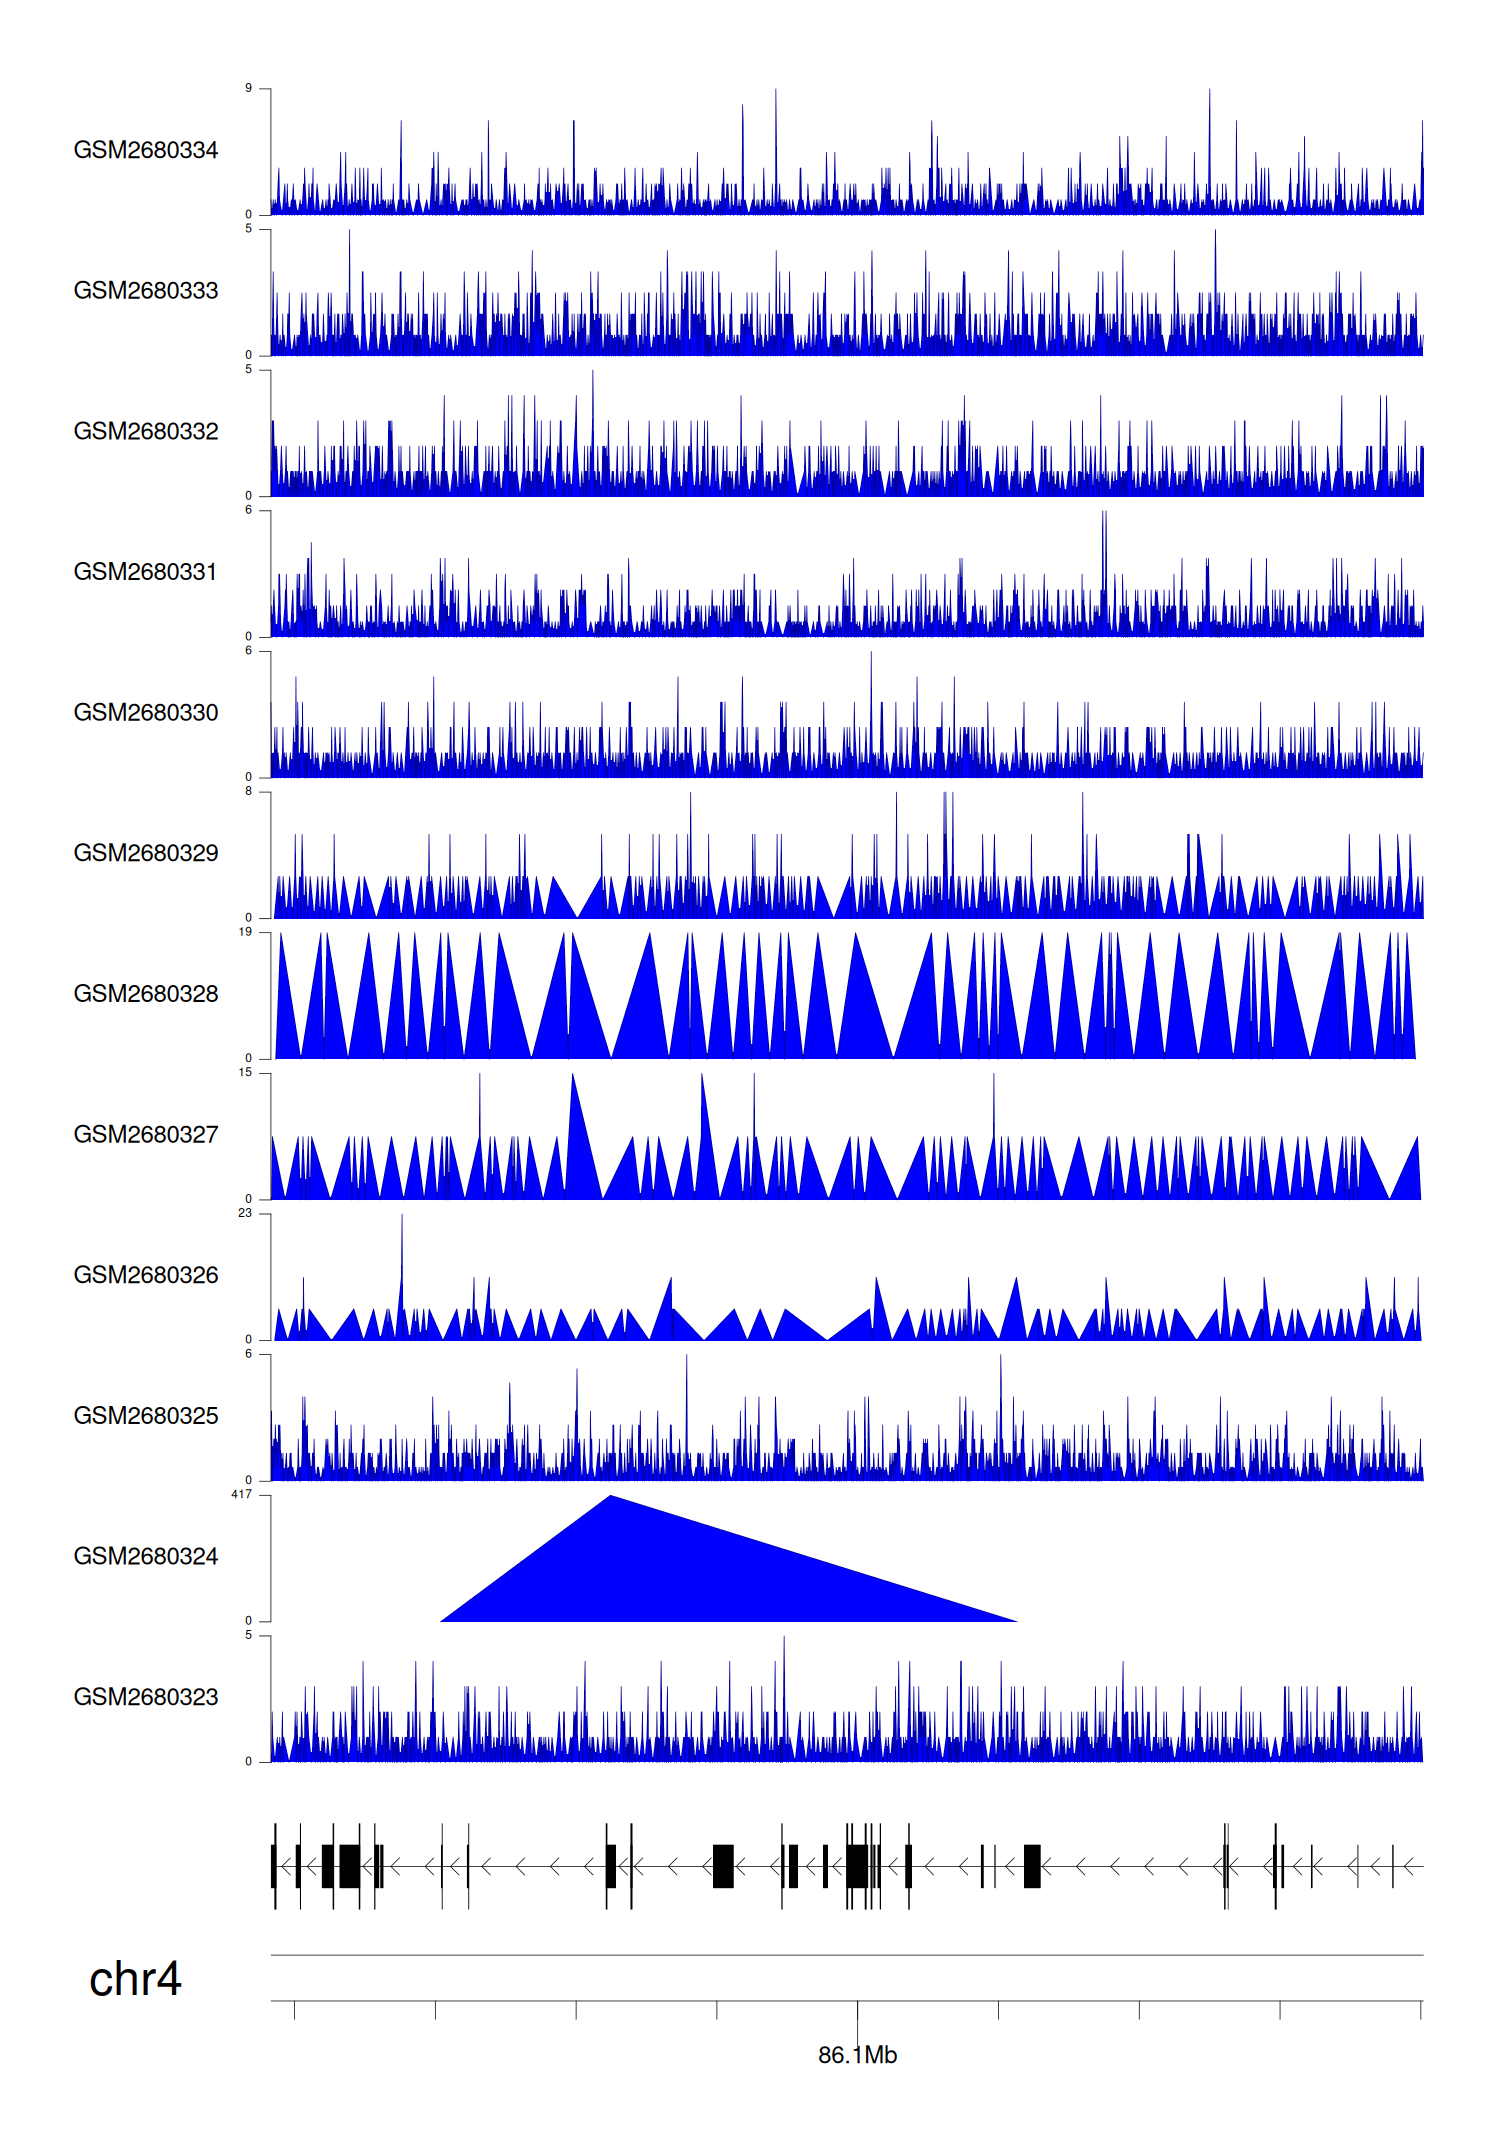
> Dataset: GSE100400 - MAPK10 peak across samples
|
Peak Plot
|
> Dataset: GSE131257 - MAPK10 peak across samples
|
Peak Plot
|
|
|
