Gene Information
|
Gene Name
|
MAPK9 |
|
Gene ID
|
5601
|
|
Gene Full Name
|
mitogen-activated protein kinase 9 |
|
Gene Alias
|
JNK-55|JNK2|JNK2A|JNK2ALPHA|JNK2B|JNK2BETA|PRKM9|SAPK|SAPK1a|p54a|p54aSAPK |
|
Transcripts
|
ENSG00000050748
|
|
Virus
|
HBV |
|
Gene Type
|
protein-coding |
|
HPA Location Info
|
Plasma membrane, Cytosol;Nuclear speckles; 
|
|
Membrane Info
|
Enzymes, Predicted intracellular proteins, RAS pathway related proteins |
|
Uniport_ID
|
P45984
|
|
HGNC ID
|
HGNC:6886
|
|
OMIM ID
|
602896 |
|
Summary
|
The protein encoded by this gene is a member of the MAP kinase family. MAP kinases act as an integration point for multiple biochemical signals, and are involved in a wide variety of cellular processes such as proliferation, differentiation, transcription regulation and development. This kinase targets specific transcription factors, and thus mediates immediate-early gene expression in response to various cell stimuli. It is most closely related to MAPK8, both of which are involved in UV radiation induced apoptosis, thought to be related to the cytochrome c-mediated cell death pathway. This gene and MAPK8 are also known as c-Jun N-terminal kinases. This kinase blocks the ubiquitination of tumor suppressor p53, and thus it increases the stability of p53 in nonstressed cells. Studies of this gene's mouse counterpart suggest a key role in T-cell differentiation. Several alternatively spliced transcript variants encoding distinct isoforms have been reported. [provided by RefSeq, Sep 2008] |
Target gene [MAPK9] related to VISs 
Integration Table: if previous studies reported that target gene was altered by virus integration events, the overlap between VISs in this literature and Cistrome factors was listed in this section
| DVID |
Chromosome |
HM |
TFBS |
CA |
Sum of Overlapped Records |
Detail |
| 1022028 |
chr5 |
5 |
0 |
0 |
5 |
View |
Target gene [MAPK9] related to Omics data
| Data ID |
Experiment type |
Sample number |
Platform |
|
GSE236281
|
RNA-seq |
12 |
Illumina MiSeq (Homo sapiens) |
|
C GSE35465
|
Chip-seq;RNA-seq |
6 |
Illumina HiSeq 2000 (Homo sapiens) |
|
C GSE68402
|
Chip-seq |
26 |
Illumina MiSeq (Homo sapiens);Illumina HiSeq 2500 (Homo sapiens) |
|
TCGA_LIHC_HBV
|
DNA methylation sequencing;RNA-seq |
97 |
TCGA |
|
C GSE270130
|
Chip-seq |
27 |
Illumina NovaSeq 6000 (Homo sapiens) |
|
GSE224901
|
RNA-seq |
21 |
Illumina NovaSeq 6000 (Homo sapiens) |
|
GSE100400
|
Chip-seq;RNA-seq;4C_cccDNA |
31 |
Illumina NextSeq 500 (Homo sapiens);Illumina NextSeq 500 (Mus musculus) |
|
GSE173897
|
RNA-seq |
95 |
Illumina HiSeq 4000 (Homo sapiens) |
|
GSE262515
|
RNA-seq |
21 |
Illumina HiSeq 2500 (Homo sapiens);Illumina HiSeq 2500 (Mus musculus) |
|
GSE110345
|
RNA-seq |
4 |
Illumina HiSeq 2500 (Homo sapiens) |
|
C GSE131257
|
ATAC-seq;RNA-seq |
19 |
Illumina HiSeq 2500 (Homo sapiens) |
|
GSE94660
|
RNA-seq |
42 |
Illumina HiSeq 2500 (Homo sapiens) |
When the gene can detect a peak in the dataset, a peak plot will be displayed.
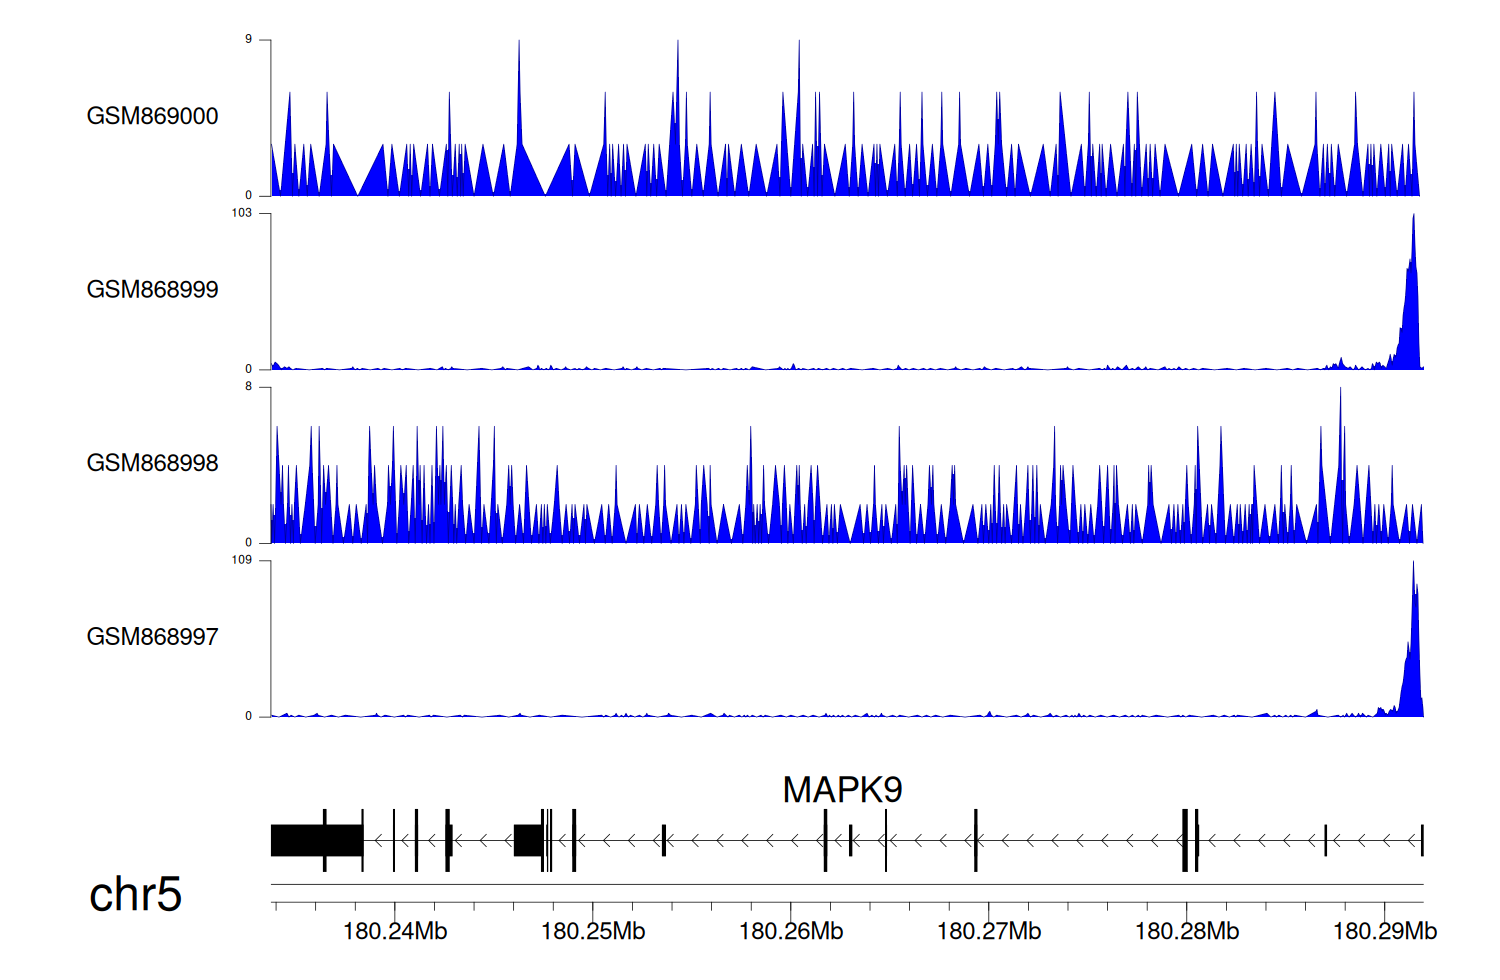
> Dataset: GSE35465 - MAPK9 peak across samples
|
Peak Plot
|
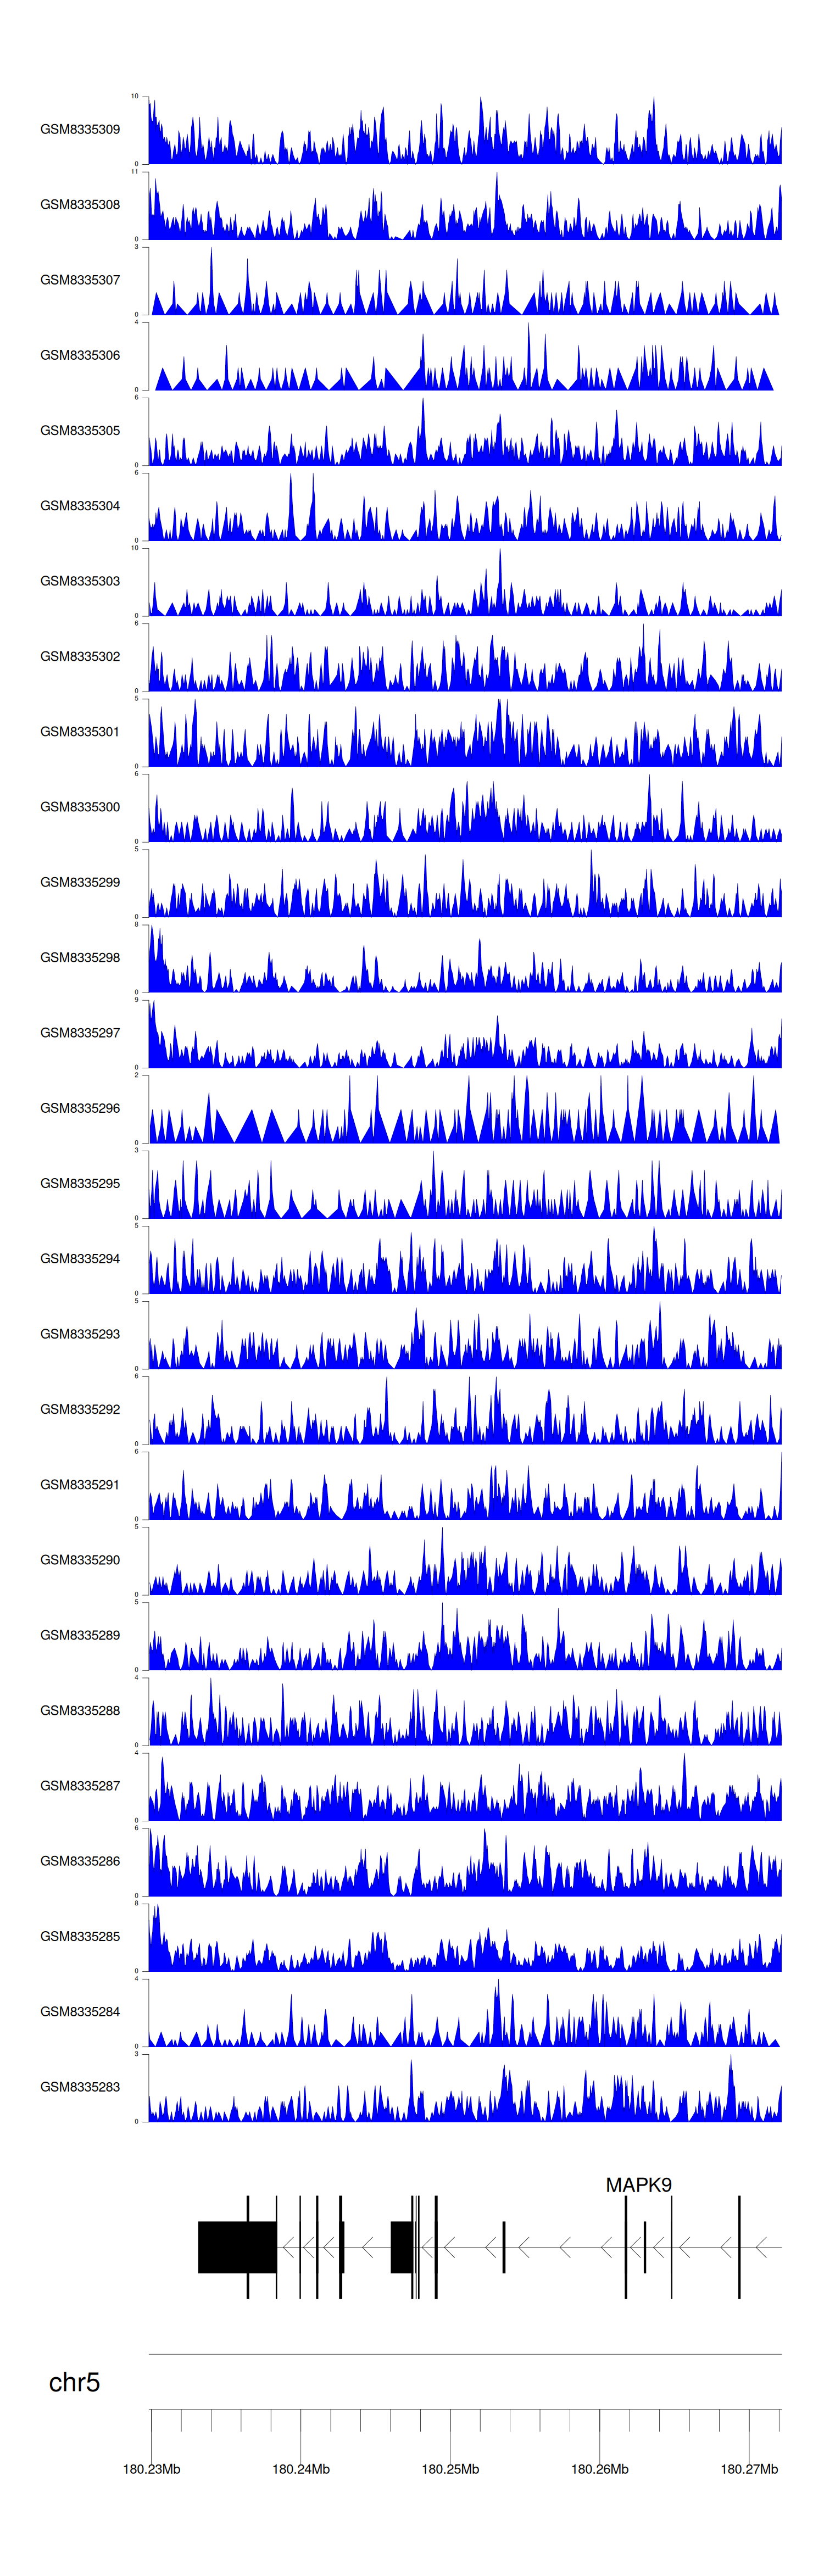
> Dataset: GSE68402 - MAPK9 peak across samples
|
Peak Plot
|
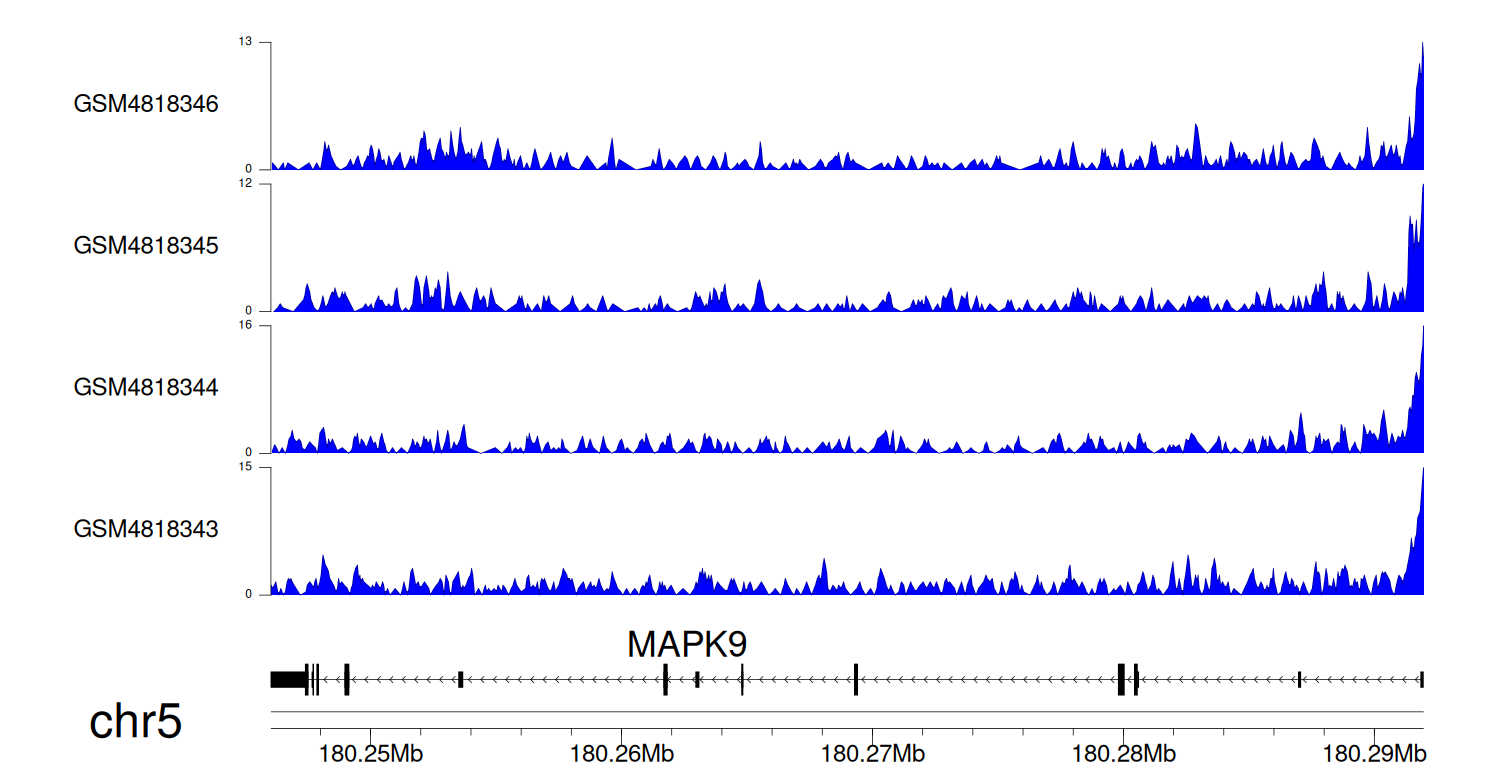
> Dataset: GSE270130 - MAPK9 peak across samples
|
Peak Plot
|
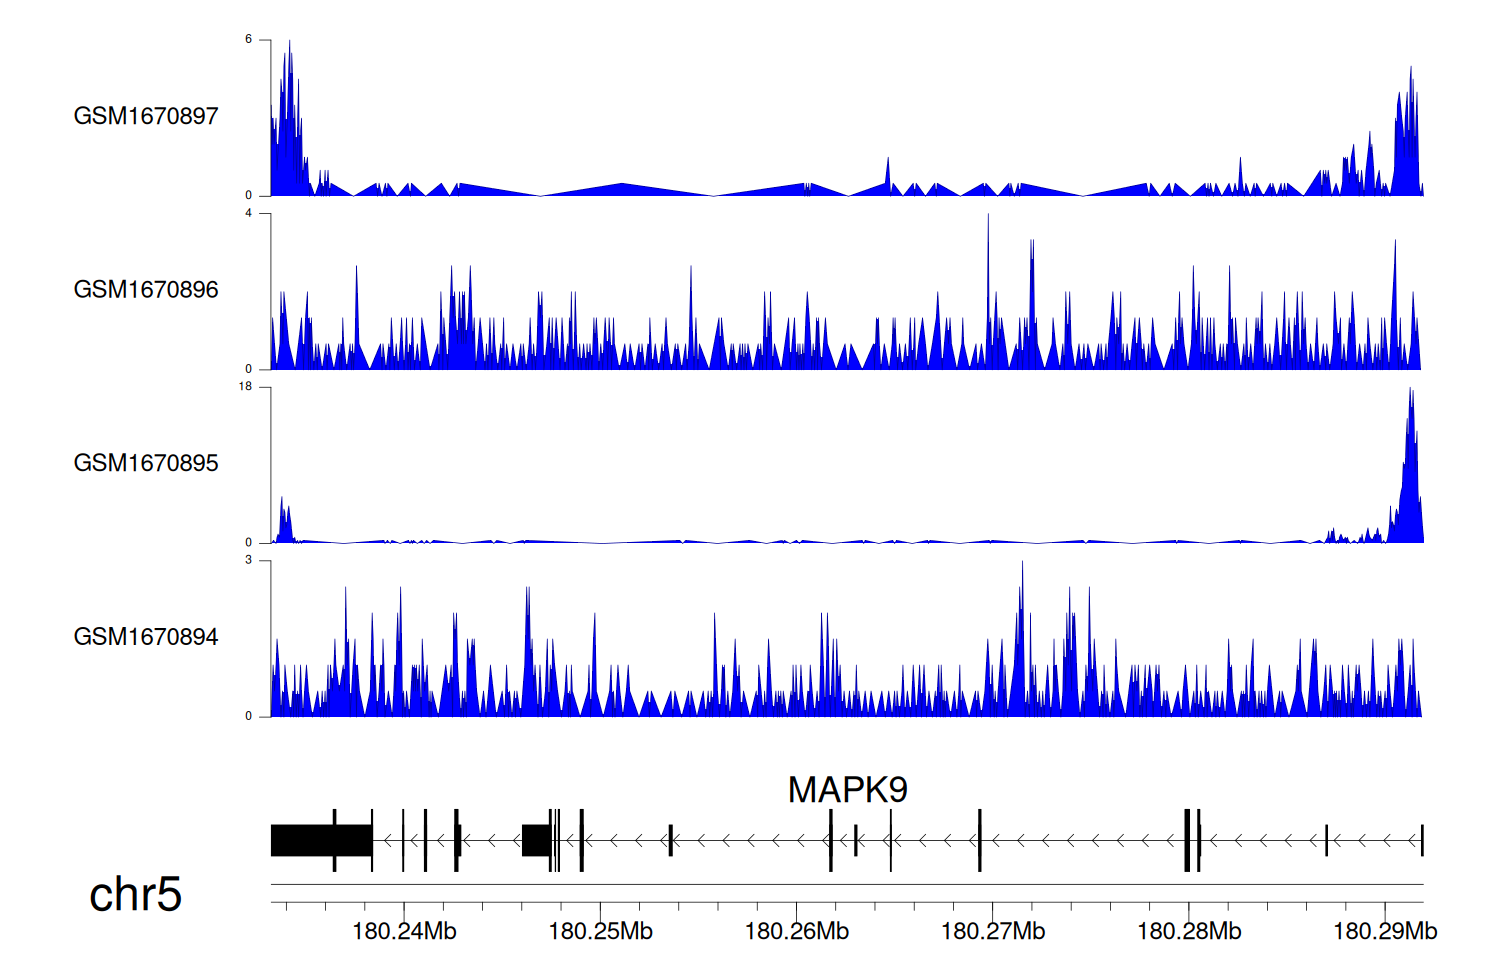
> Dataset: GSE131257 - MAPK9 peak across samples
|
Peak Plot
|
|
|
