Gene Information
|
Gene Name
|
MPIG6B |
|
Gene ID
|
80739
|
|
Gene Full Name
|
megakaryocyte and platelet inhibitory receptor G6b |
|
Gene Alias
|
C6orf25|G6b|G6b-B|NG31|THAMY |
|
Transcripts
|
ENSG00000204420
|
|
Virus
|
HPV |
|
Gene Type
|
protein-coding |
|
HPA Location Info
|
Golgi apparatus;Nucleoplasm, Endoplasmic reticulum, Plasma membrane, Cytosol;Intracellular and membrane; 
|
|
Membrane Info
|
Disease related genes, Human disease related genes, Predicted intracellular proteins, Predicted membrane proteins |
|
Uniport_ID
|
O95866
|
|
HGNC ID
|
HGNC:13937
|
|
OMIM ID
|
606520 |
|
Summary
|
This gene is a member of the immunoglobulin (Ig) superfamily and is located in the major histocompatibility complex (MHC) class III region. The protein encoded by this gene is a glycosylated, plasma membrane-bound cell surface receptor, but soluble isoforms encoded by some transcript variants have been found in the endoplasmic reticulum and Golgi before being secreted. Multiple transcript variants encoding different isoforms have been found for this gene. [provided by RefSeq, Jul 2008] |
Target gene [MPIG6B] related to VISs 
Integration Table: if previous studies reported that target gene was altered by virus integration events, the overlap between VISs in this literature and Cistrome factors was listed in this section
| DVID |
Chromosome |
HM |
TFBS |
CA |
Sum of Overlapped Records |
Detail |
| 5016117 |
chr6 |
13 |
0 |
0 |
13 |
View |
| 5016118 |
chr6 |
53 |
133 |
84 |
270 |
View |
Target gene [MPIG6B] related to Omics data
| Data ID |
Experiment type |
Sample number |
Platform |
|
C GSE183048
|
Chip-seq |
24 |
Illumina HiSeq 4000 (Homo sapiens) |
|
GSE181805
|
Expression array |
25 |
[HTA-2_0] Affymetrix Human Transcriptome Array 2.0 [transcript (gene) version] |
|
GSE140662
|
Expression array |
8 |
[HTA-2_0] Affymetrix Human Transcriptome Array 2.0 [transcript (gene) version] |
|
TCGA_CESC
|
DNA methylation sequencing;RNA-seq |
288 |
TCGA |
|
C GSE143026
|
ATAC-seq;Chip-seq;RNA-seq |
30 |
Illumina HiSeq 2500 (Homo sapiens) |
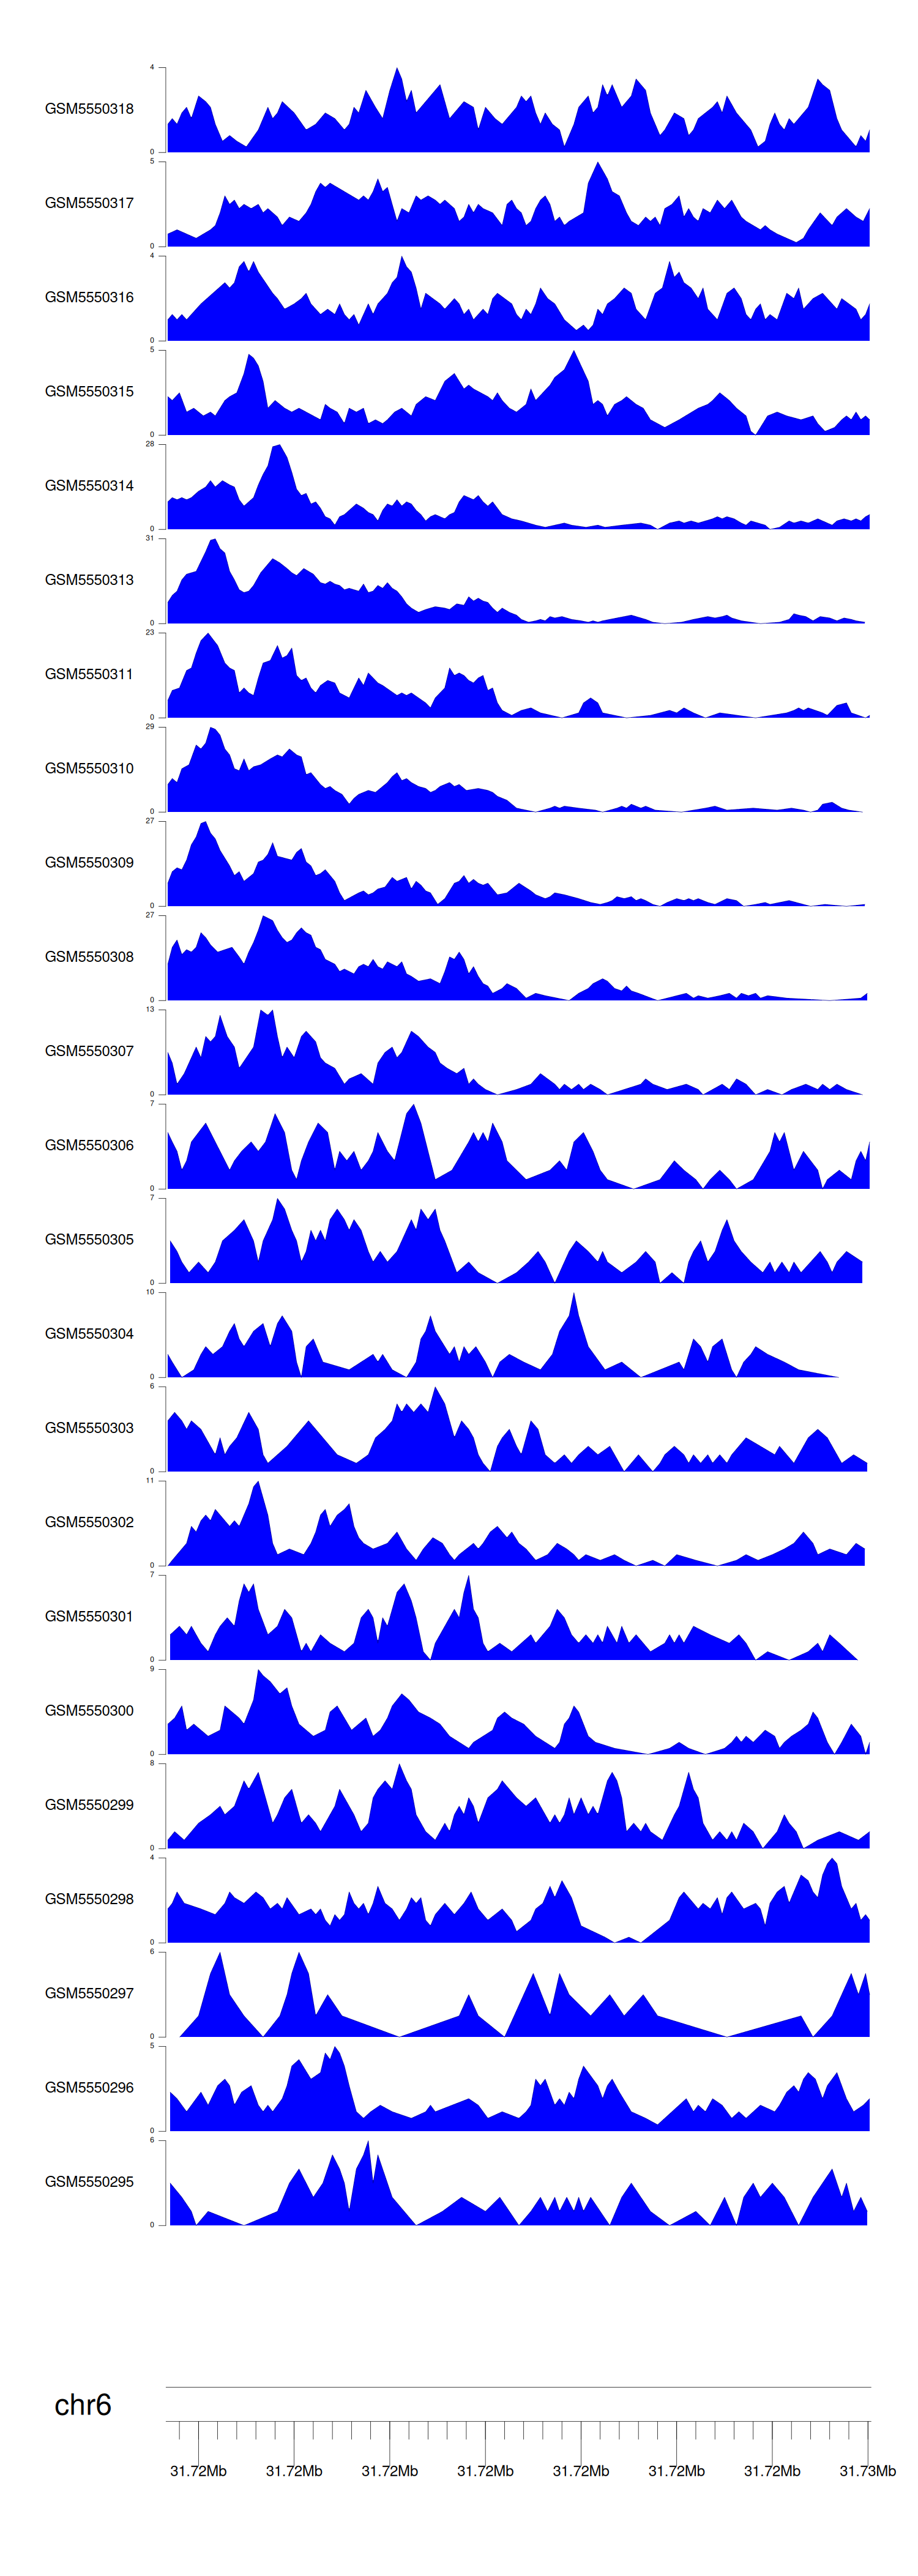
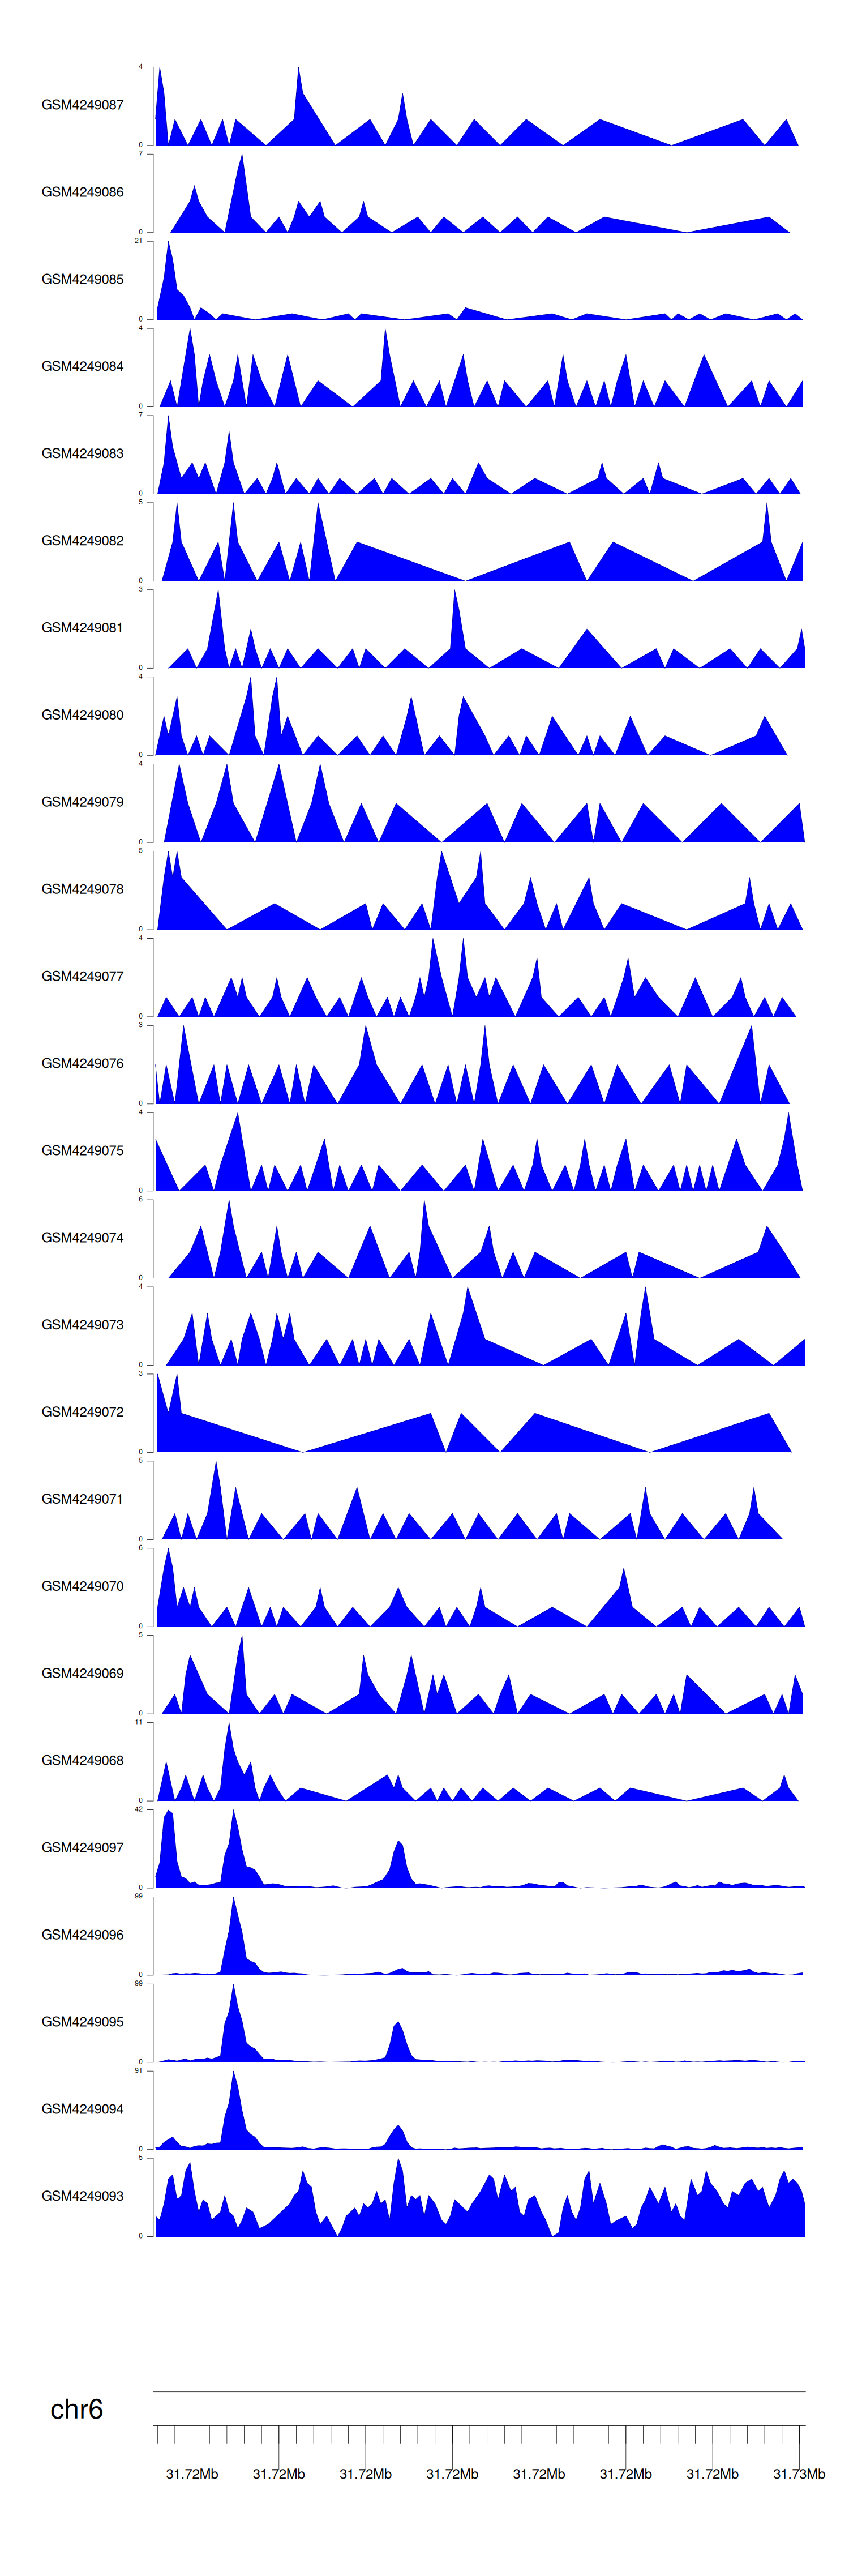
When the gene can detect a peak in the dataset, a peak plot will be displayed.
> Dataset: GSE183048 - MPIG6B peak across samples
|
Peak Plot
|
> Dataset: GSE143026 - MPIG6B peak across samples
|
Peak Plot
|
|
|
