Gene Information
|
Gene Name
|
MTARC2 |
|
Gene ID
|
54996
|
|
Gene Full Name
|
mitochondrial amidoxime reducing component 2 |
|
Gene Alias
|
MARC2|MOSC2 |
|
Transcripts
|
ENSG00000117791
|
|
Virus
|
HBV |
|
Gene Type
|
protein-coding |
|
HPA Location Info
|

|
|
Membrane Info
|
Predicted intracellular proteins, Predicted membrane proteins |
|
Uniport_ID
|
Q969Z3
|
|
HGNC ID
|
HGNC:26064
|
|
OMIM ID
|
614127 |
|
Summary
|
The protein encoded by this gene is an enzyme found in the outer mitochondrial membrane that reduces N-hydroxylated substrates. The encoded protein uses molybdenum as a cofactor and cytochrome b5 type B and NADH cytochrome b5 reductase as accessory proteins. One type of substrate used is N-hydroxylated nucleotide base analogues, which can be toxic to a cell. Other substrates include N(omega)-hydroxy-L-arginine (NOHA) and amidoxime prodrugs, which are activated by the encoded enzyme. Multiple transcript variants encoding the different isoforms have been found for this gene. [provided by RefSeq, Sep 2016] |
Target gene [MTARC2] related to VISs 
Integration Table: if previous studies reported that target gene was altered by virus integration events, the overlap between VISs in this literature and Cistrome factors was listed in this section
| DVID |
Chromosome |
HM |
TFBS |
CA |
Sum of Overlapped Records |
Detail |
| 1024563 |
chr1 |
8 |
0 |
0 |
8 |
View |
Target gene [MTARC2] related to Omics data
| Data ID |
Experiment type |
Sample number |
Platform |
|
C GSE35465
|
Chip-seq;RNA-seq |
6 |
Illumina HiSeq 2000 (Homo sapiens) |
|
C GSE68402
|
Chip-seq |
26 |
Illumina MiSeq (Homo sapiens);Illumina HiSeq 2500 (Homo sapiens) |
|
C GSE270130
|
Chip-seq |
27 |
Illumina NovaSeq 6000 (Homo sapiens) |
|
GSE224901
|
RNA-seq |
21 |
Illumina NovaSeq 6000 (Homo sapiens) |
|
E GSE100400
|
Chip-seq;RNA-seq;4C_cccDNA |
31 |
Illumina NextSeq 500 (Homo sapiens);Illumina NextSeq 500 (Mus musculus) |
|
GSE173897
|
RNA-seq |
95 |
Illumina HiSeq 4000 (Homo sapiens) |
|
C GSE131257
|
ATAC-seq;RNA-seq |
19 |
Illumina HiSeq 2500 (Homo sapiens) |
|
GSE94660
|
RNA-seq |
42 |
Illumina HiSeq 2500 (Homo sapiens) |
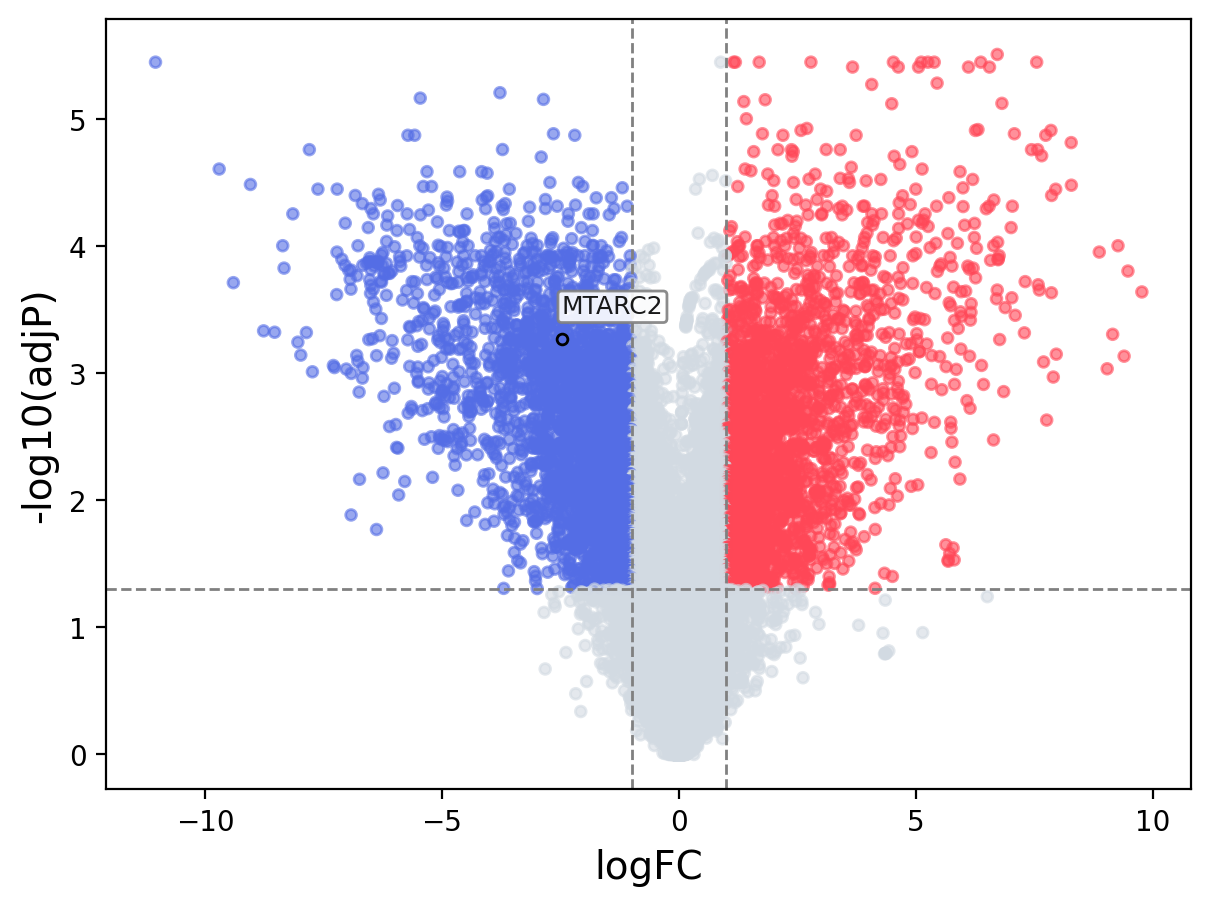
When the query gene is differentially changed in the dataset, a volcano/bar plot will be displayed.
> Dataset: GSE100400 - MTARC2 expression across samples
|
Volcano Plot
|
Bar Plot
|
|
|
