Gene Information
|
Gene Name
|
MYOM1 |
|
Gene ID
|
8736
|
|
Gene Full Name
|
myomesin 1 |
|
Gene Alias
|
SKELEMIN |
|
Transcripts
|
ENSG00000101605
|
|
Virus
|
HBV |
|
Gene Type
|
protein-coding |
|
HPA Location Info
|

|
|
Membrane Info
|
Predicted intracellular proteins |
|
Uniport_ID
|
P52179
|
|
HGNC ID
|
HGNC:7613
|
|
OMIM ID
|
603508 |
|
Summary
|
The giant protein titin, together with its associated proteins, interconnects the major structure of sarcomeres, the M bands and Z discs. The C-terminal end of the titin string extends into the M line, where it binds tightly to M-band constituents of apparent molecular masses of 190 kD (myomesin 1) and 165 kD (myomesin 2). This protein, myomesin 1, like myomesin 2, titin, and other myofibrillar proteins contains structural modules with strong homology to either fibronectin type III (motif I) or immunoglobulin C2 (motif II) domains. Myomesin 1 and myomesin 2 each have a unique N-terminal region followed by 12 modules of motif I or motif II, in the arrangement II-II-I-I-I-I-I-II-II-II-II-II. The two proteins share 50% sequence identity in this repeat-containing region. The head structure formed by these 2 proteins on one end of the titin string extends into the center of the M band. The integrating structure of the sarcomere arises from muscle-specific members of the superfamily of immunoglobulin-like proteins. Alternatively spliced transcript variants encoding different isoforms have been identified. [provided by RefSeq, Jul 2008] |
Target gene [MYOM1] related to VISs 
Integration Table: if previous studies reported that target gene was altered by virus integration events, the overlap between VISs in this literature and Cistrome factors was listed in this section
| DVID |
Chromosome |
HM |
TFBS |
CA |
Sum of Overlapped Records |
Detail |
| 1007836 |
chr18 |
20 |
4 |
0 |
24 |
View |
| 1011132 |
chr18 |
10 |
0 |
0 |
10 |
View |
| 1011204 |
chr18 |
10 |
0 |
0 |
10 |
View |
Target gene [MYOM1] related to Omics data
| Data ID |
Experiment type |
Sample number |
Platform |
|
GSE236281
|
RNA-seq |
12 |
Illumina MiSeq (Homo sapiens) |
|
C GSE35465
|
Chip-seq;RNA-seq |
6 |
Illumina HiSeq 2000 (Homo sapiens) |
|
C GSE68402
|
Chip-seq |
26 |
Illumina MiSeq (Homo sapiens);Illumina HiSeq 2500 (Homo sapiens) |
|
TCGA_LIHC_HBV
|
DNA methylation sequencing;RNA-seq |
97 |
TCGA |
|
C GSE270130
|
Chip-seq |
27 |
Illumina NovaSeq 6000 (Homo sapiens) |
|
GSE224901
|
RNA-seq |
21 |
Illumina NovaSeq 6000 (Homo sapiens) |
|
E GSE100400
|
Chip-seq;RNA-seq;4C_cccDNA |
31 |
Illumina NextSeq 500 (Homo sapiens);Illumina NextSeq 500 (Mus musculus) |
|
GSE173897
|
RNA-seq |
95 |
Illumina HiSeq 4000 (Homo sapiens) |
|
GSE262515
|
RNA-seq |
21 |
Illumina HiSeq 2500 (Homo sapiens);Illumina HiSeq 2500 (Mus musculus) |
|
GSE110345
|
RNA-seq |
4 |
Illumina HiSeq 2500 (Homo sapiens) |
|
C GSE131257
|
ATAC-seq;RNA-seq |
19 |
Illumina HiSeq 2500 (Homo sapiens) |
|
GSE94660
|
RNA-seq |
42 |
Illumina HiSeq 2500 (Homo sapiens) |
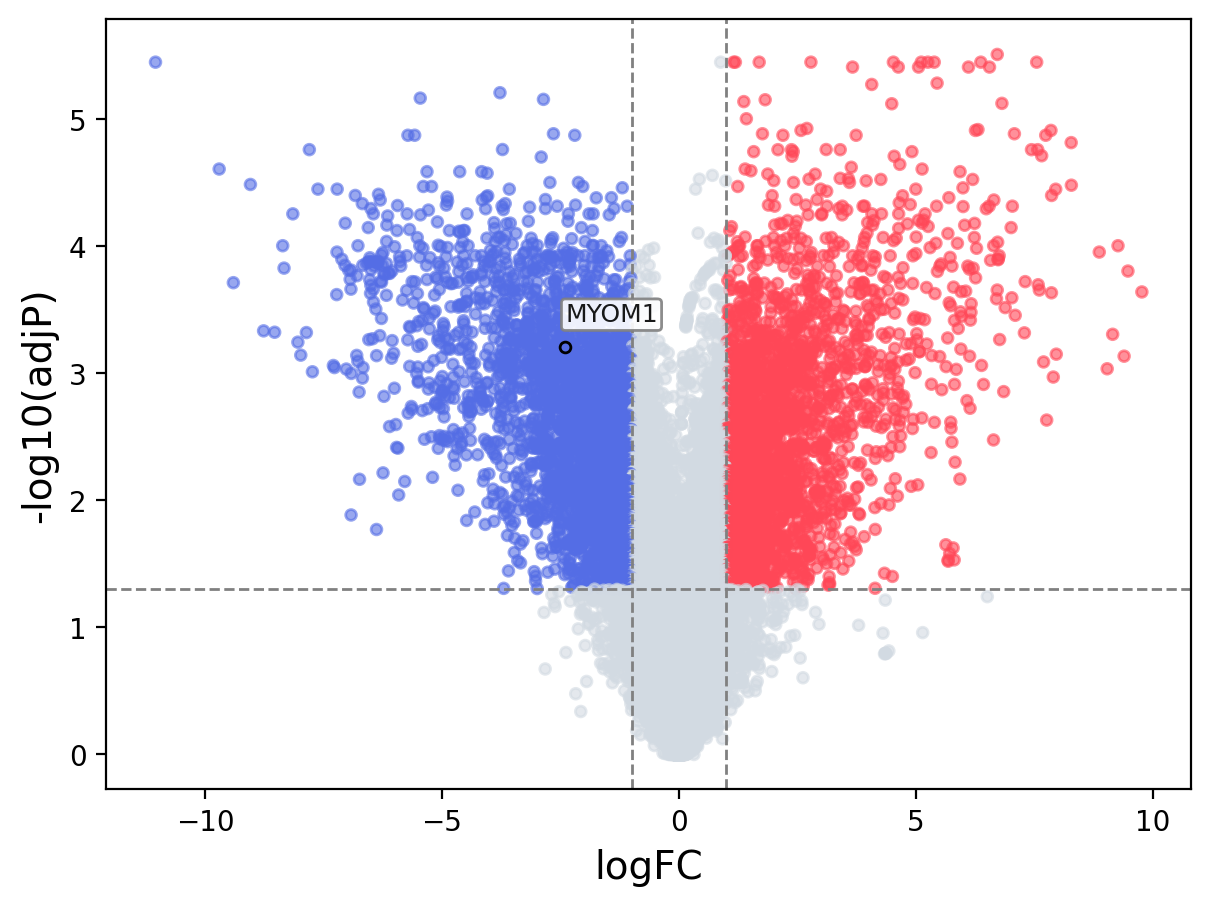
When the query gene is differentially changed in the dataset, a volcano/bar plot will be displayed.
> Dataset: GSE100400 - MYOM1 expression across samples
|
Volcano Plot
|
Bar Plot
|
|
|
