Gene Information
|
Gene Name
|
OPRL1 |
|
Gene ID
|
4987
|
|
Gene Full Name
|
opioid related nociceptin receptor 1 |
|
Gene Alias
|
KOR-3|KOR3|NOCIR|NOP|NOPr|OOR|OPRL|ORL1|PNOCR |
|
Transcripts
|
ENSG00000125510
|
|
Virus
|
HBV |
|
Gene Type
|
protein-coding |
|
HPA Location Info
|
Primary cilium, Primary cilium tip; 
|
|
Membrane Info
|
G-protein coupled receptors, Predicted membrane proteins |
|
Uniport_ID
|
P41146
|
|
HGNC ID
|
HGNC:8155
|
|
OMIM ID
|
602548 |
|
Summary
|
The protein encoded by this gene is a member of the 7 transmembrane-spanning G protein-coupled receptor family, and functions as a receptor for the endogenous, opioid-related neuropeptide, nociceptin/orphanin FQ. This receptor-ligand system modulates a variety of biological functions and neurobehavior, including stress responses and anxiety behavior, learning and memory, locomotor activity, and inflammatory and immune responses. A promoter region between this gene and the 5'-adjacent RGS19 (regulator of G-protein signaling 19) gene on the opposite strand functions bi-directionally as a core-promoter for both genes, suggesting co-operative transcriptional regulation of these two functionally related genes. Alternatively spliced transcript variants have been described for this gene. A recent study provided evidence for translational readthrough in this gene, and expression of an additional C-terminally extended isoform via the use of an alternative in-frame translation termination codon. [provided by RefSeq, Dec 2017] |
Target gene [OPRL1] related to VISs 
Integration Table: if previous studies reported that target gene was altered by virus integration events, the overlap between VISs in this literature and Cistrome factors was listed in this section
| DVID |
Chromosome |
HM |
TFBS |
CA |
Sum of Overlapped Records |
Detail |
| 1042676 |
chr20 |
61 |
5 |
0 |
66 |
View |
| 1042677 |
chr20 |
111 |
3 |
0 |
114 |
View |
Target gene [OPRL1] related to Omics data
| Data ID |
Experiment type |
Sample number |
Platform |
|
GSE236281
|
RNA-seq |
12 |
Illumina MiSeq (Homo sapiens) |
|
C GSE35465
|
Chip-seq;RNA-seq |
6 |
Illumina HiSeq 2000 (Homo sapiens) |
|
C GSE68402
|
Chip-seq |
26 |
Illumina MiSeq (Homo sapiens);Illumina HiSeq 2500 (Homo sapiens) |
|
TCGA_LIHC_HBV
|
DNA methylation sequencing;RNA-seq |
97 |
TCGA |
|
C GSE270130
|
Chip-seq |
27 |
Illumina NovaSeq 6000 (Homo sapiens) |
|
GSE224901
|
RNA-seq |
21 |
Illumina NovaSeq 6000 (Homo sapiens) |
|
C GSE100400
|
Chip-seq;RNA-seq;4C_cccDNA |
31 |
Illumina NextSeq 500 (Homo sapiens);Illumina NextSeq 500 (Mus musculus) |
|
GSE173897
|
RNA-seq |
95 |
Illumina HiSeq 4000 (Homo sapiens) |
|
GSE262515
|
RNA-seq |
21 |
Illumina HiSeq 2500 (Homo sapiens);Illumina HiSeq 2500 (Mus musculus) |
|
GSE110345
|
RNA-seq |
4 |
Illumina HiSeq 2500 (Homo sapiens) |
|
C GSE131257
|
ATAC-seq;RNA-seq |
19 |
Illumina HiSeq 2500 (Homo sapiens) |
|
GSE94660
|
RNA-seq |
42 |
Illumina HiSeq 2500 (Homo sapiens) |
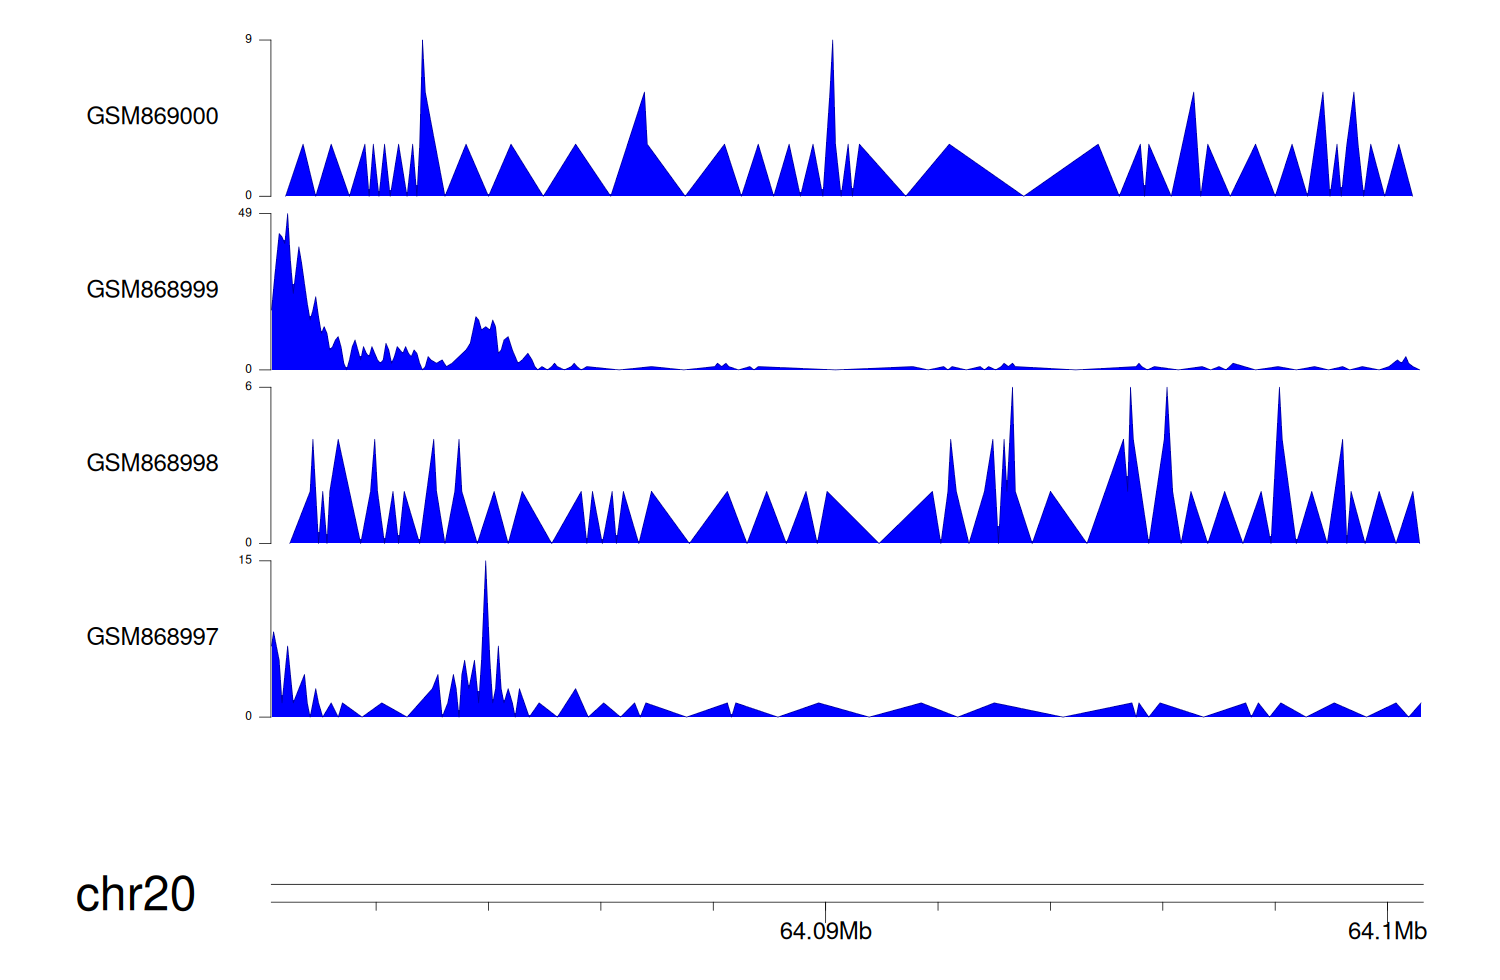
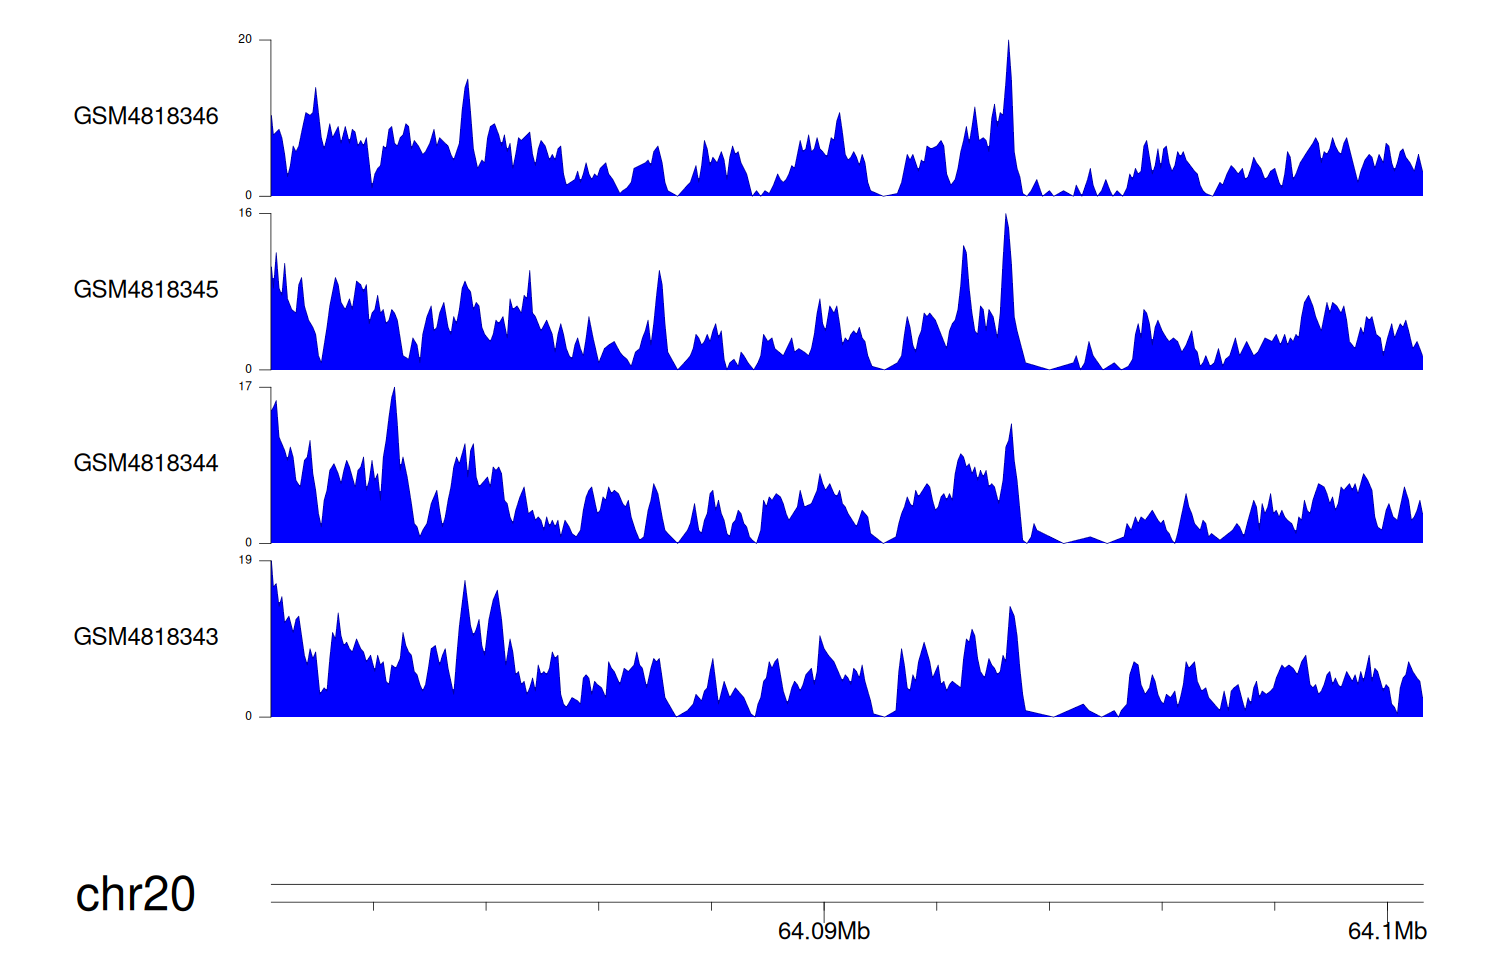
When the gene can detect a peak in the dataset, a peak plot will be displayed.
> Dataset: GSE35465 - OPRL1 peak across samples
|
Peak Plot
|
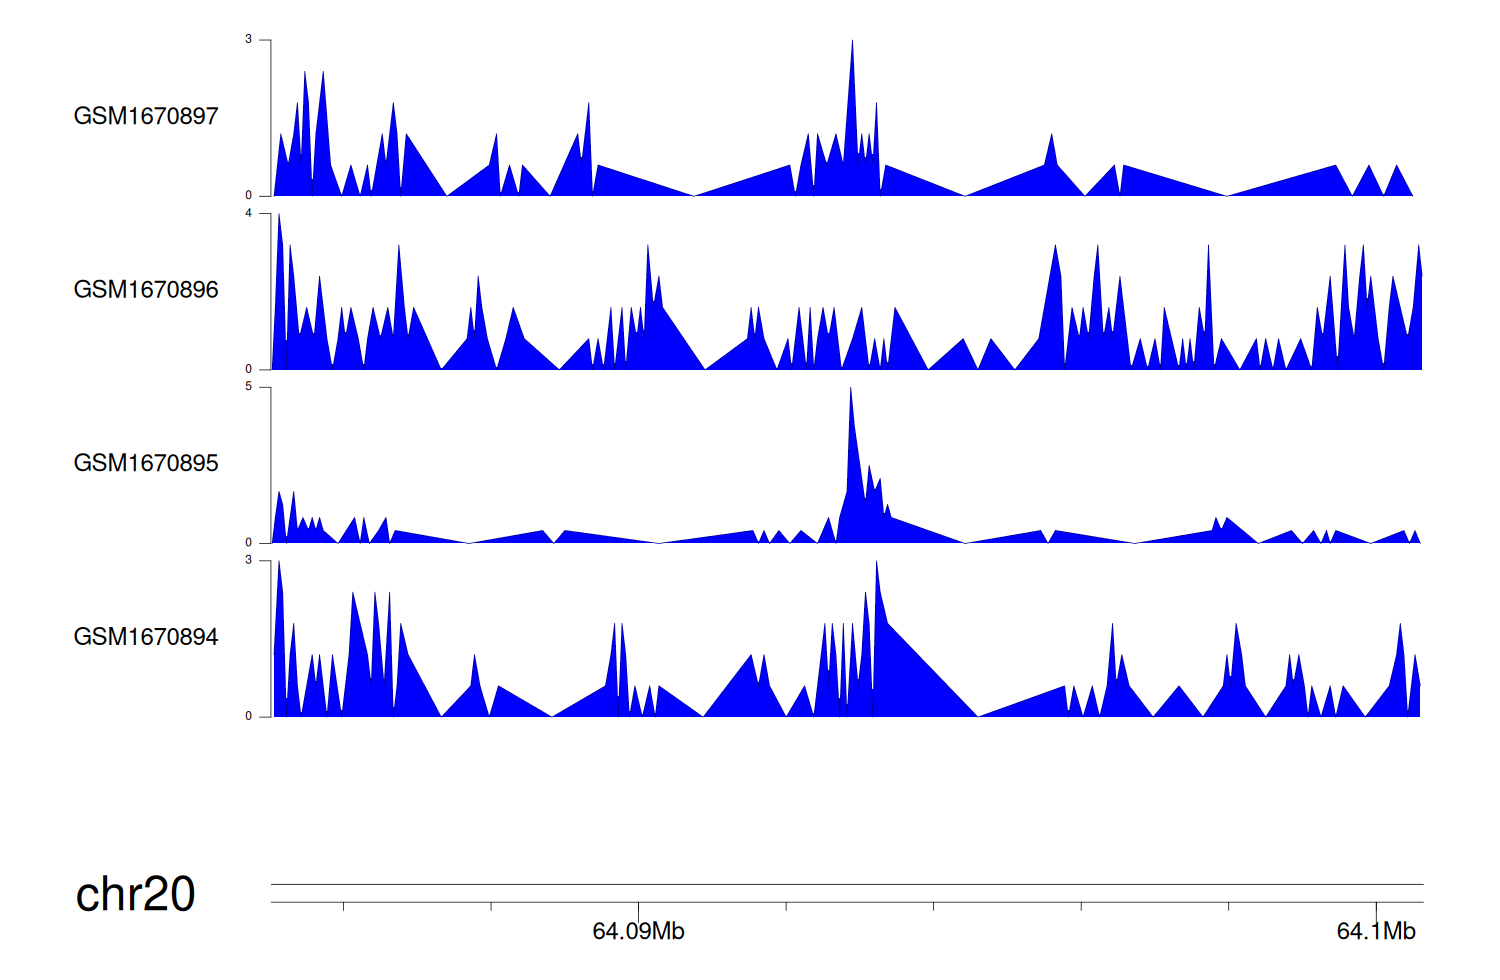
> Dataset: GSE68402 - OPRL1 peak across samples
|
Peak Plot
|
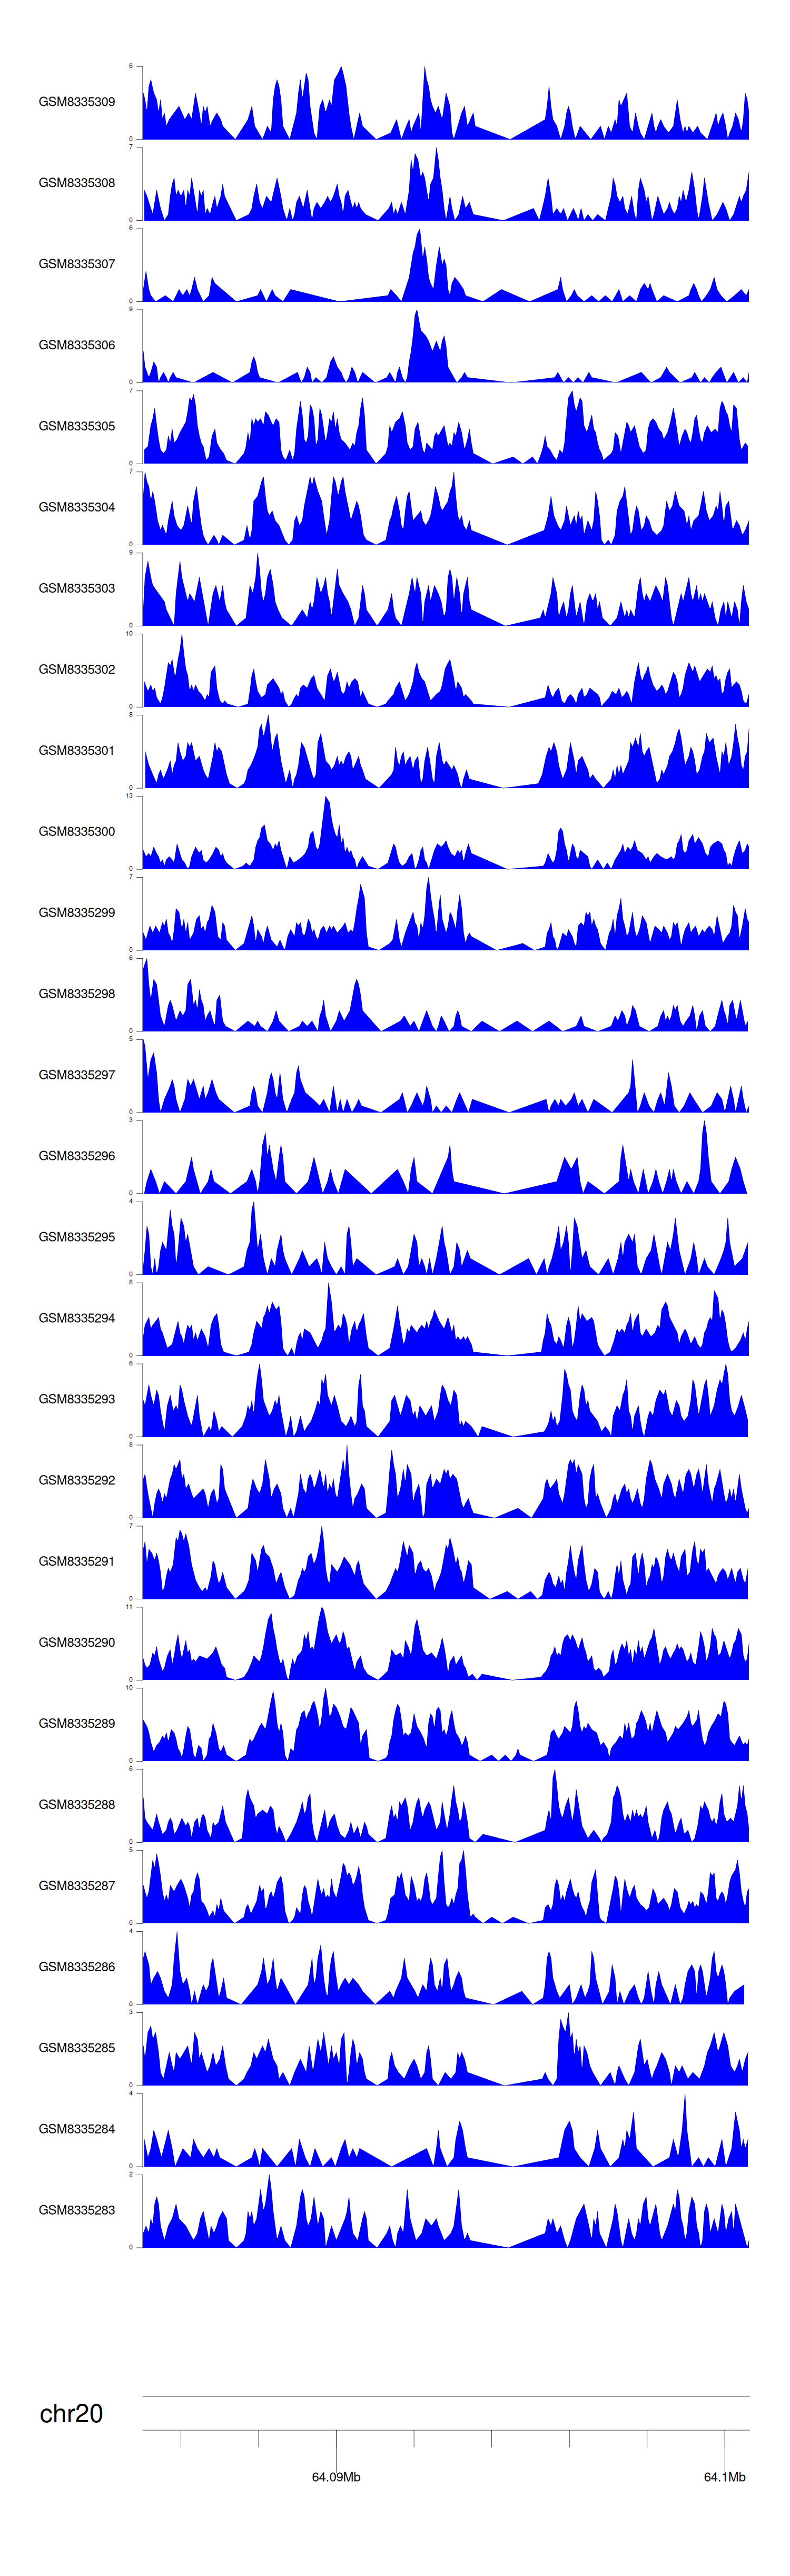
> Dataset: GSE270130 - OPRL1 peak across samples
|
Peak Plot
|
> Dataset: GSE100400 - OPRL1 peak across samples
|
Peak Plot
|
> Dataset: GSE131257 - OPRL1 peak across samples
|
Peak Plot
|
|
|
