Gene Information
|
Gene Name
|
PDHX |
|
Gene ID
|
8050
|
|
Gene Full Name
|
pyruvate dehydrogenase complex component X |
|
Gene Alias
|
DLDBP|E3BP|OPDX|PDHXD|PDX1|proX |
|
Transcripts
|
ENSG00000110435
|
|
Virus
|
HBV |
|
Gene Type
|
protein-coding |
|
HPA Location Info
|
Nucleoplasm, Mitochondria;Plasma membrane; 
|
|
Membrane Info
|
Disease related genes, Human disease related genes, Metabolic proteins, Plasma proteins, Predicted intracellular proteins |
|
Uniport_ID
|
O00330
|
|
HGNC ID
|
HGNC:21350
|
|
OMIM ID
|
608769 |
|
Summary
|
The pyruvate dehydrogenase (PDH) complex is located in the mitochondrial matrix and catalyzes the conversion of pyruvate to acetyl coenzyme A. The PDH complex thereby links glycolysis to Krebs cycle. The PDH complex contains three catalytic subunits, E1, E2, and E3, two regulatory subunits, E1 kinase and E1 phosphatase, and a non-catalytic subunit, E3 binding protein (E3BP). This gene encodes the E3 binding protein subunit; also known as component X of the pyruvate dehydrogenase complex. This protein tethers E3 dimers to the E2 core of the PDH complex. Defects in this gene are a cause of pyruvate dehydrogenase deficiency which results in neurological dysfunction and lactic acidosis in infancy and early childhood. This protein is also a minor antigen for antimitochondrial antibodies. These autoantibodies are present in nearly 95% of patients with the autoimmune liver disease primary biliary cirrhosis (PBC). In PBC, activated T lymphocytes attack and destroy epithelial cells in the bile duct where this protein is abnormally distributed and overexpressed. PBC eventually leads to cirrhosis and liver failure. Alternative splicing results in multiple transcript variants encoding distinct isoforms.[provided by RefSeq, Oct 2009] |
Target gene [PDHX] related to VISs 
Integration Table: if previous studies reported that target gene was altered by virus integration events, the overlap between VISs in this literature and Cistrome factors was listed in this section
| DVID |
Chromosome |
HM |
TFBS |
CA |
Sum of Overlapped Records |
Detail |
| 1041875 |
chr11 |
10 |
4 |
1 |
15 |
View |
Target gene [PDHX] related to Omics data
| Data ID |
Experiment type |
Sample number |
Platform |
|
GSE236281
|
RNA-seq |
12 |
Illumina MiSeq (Homo sapiens) |
|
C GSE35465
|
Chip-seq;RNA-seq |
6 |
Illumina HiSeq 2000 (Homo sapiens) |
|
C GSE68402
|
Chip-seq |
26 |
Illumina MiSeq (Homo sapiens);Illumina HiSeq 2500 (Homo sapiens) |
|
TCGA_LIHC_HBV
|
DNA methylation sequencing;RNA-seq |
97 |
TCGA |
|
C GSE270130
|
Chip-seq |
27 |
Illumina NovaSeq 6000 (Homo sapiens) |
|
GSE224901
|
RNA-seq |
21 |
Illumina NovaSeq 6000 (Homo sapiens) |
|
C GSE100400
|
Chip-seq;RNA-seq;4C_cccDNA |
31 |
Illumina NextSeq 500 (Homo sapiens);Illumina NextSeq 500 (Mus musculus) |
|
GSE173897
|
RNA-seq |
95 |
Illumina HiSeq 4000 (Homo sapiens) |
|
GSE262515
|
RNA-seq |
21 |
Illumina HiSeq 2500 (Homo sapiens);Illumina HiSeq 2500 (Mus musculus) |
|
GSE110345
|
RNA-seq |
4 |
Illumina HiSeq 2500 (Homo sapiens) |
|
C GSE131257
|
ATAC-seq;RNA-seq |
19 |
Illumina HiSeq 2500 (Homo sapiens) |
|
GSE94660
|
RNA-seq |
42 |
Illumina HiSeq 2500 (Homo sapiens) |
When the gene can detect a peak in the dataset, a peak plot will be displayed.
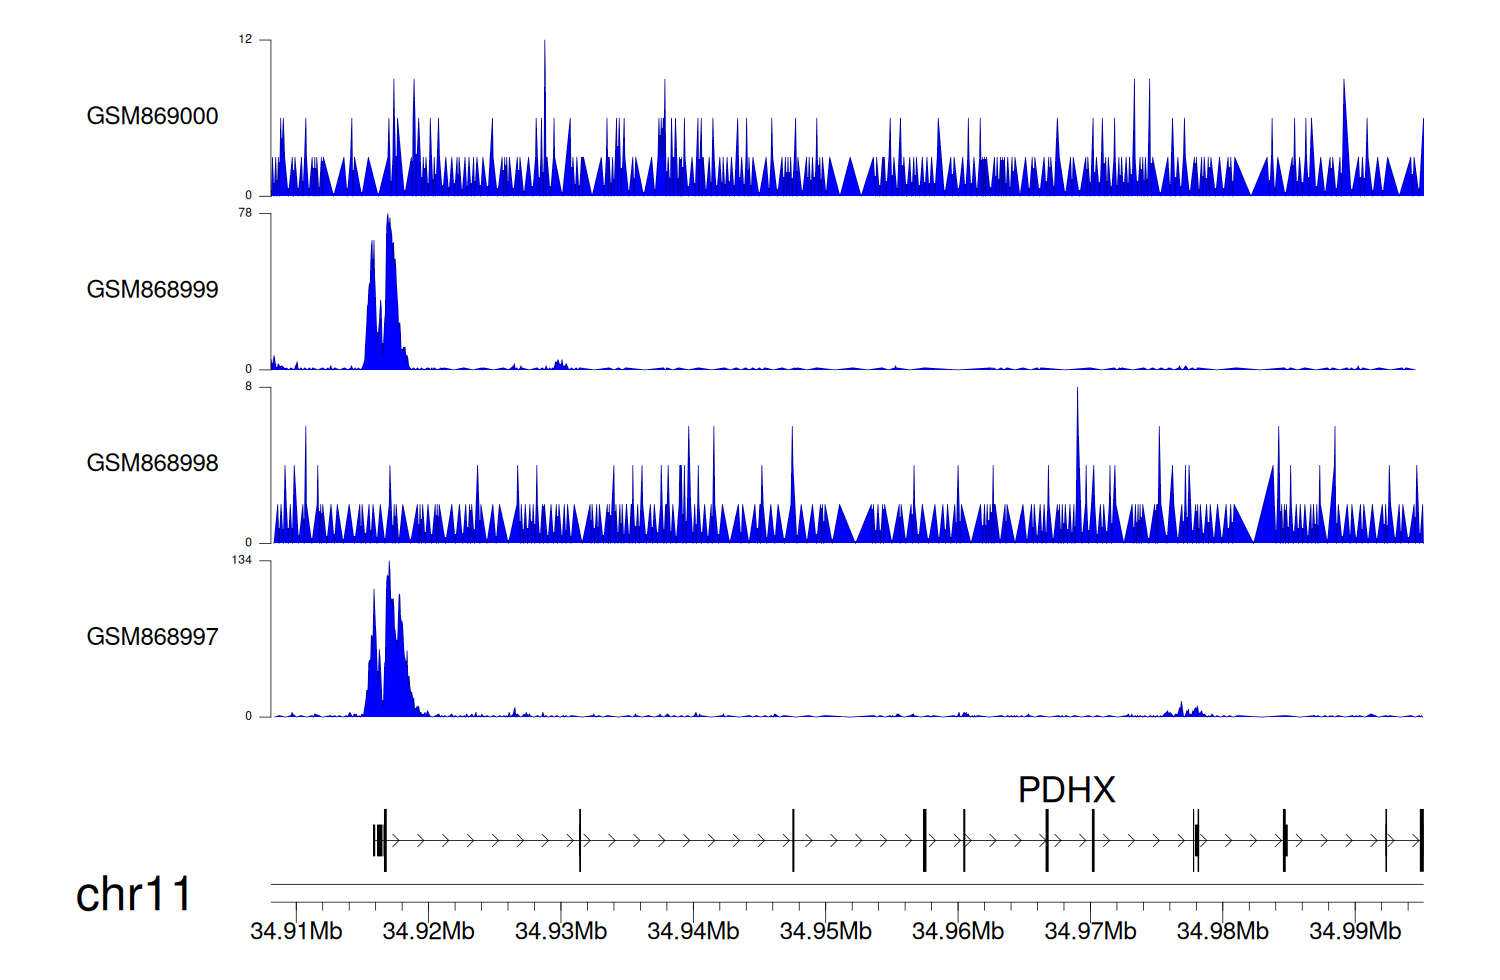
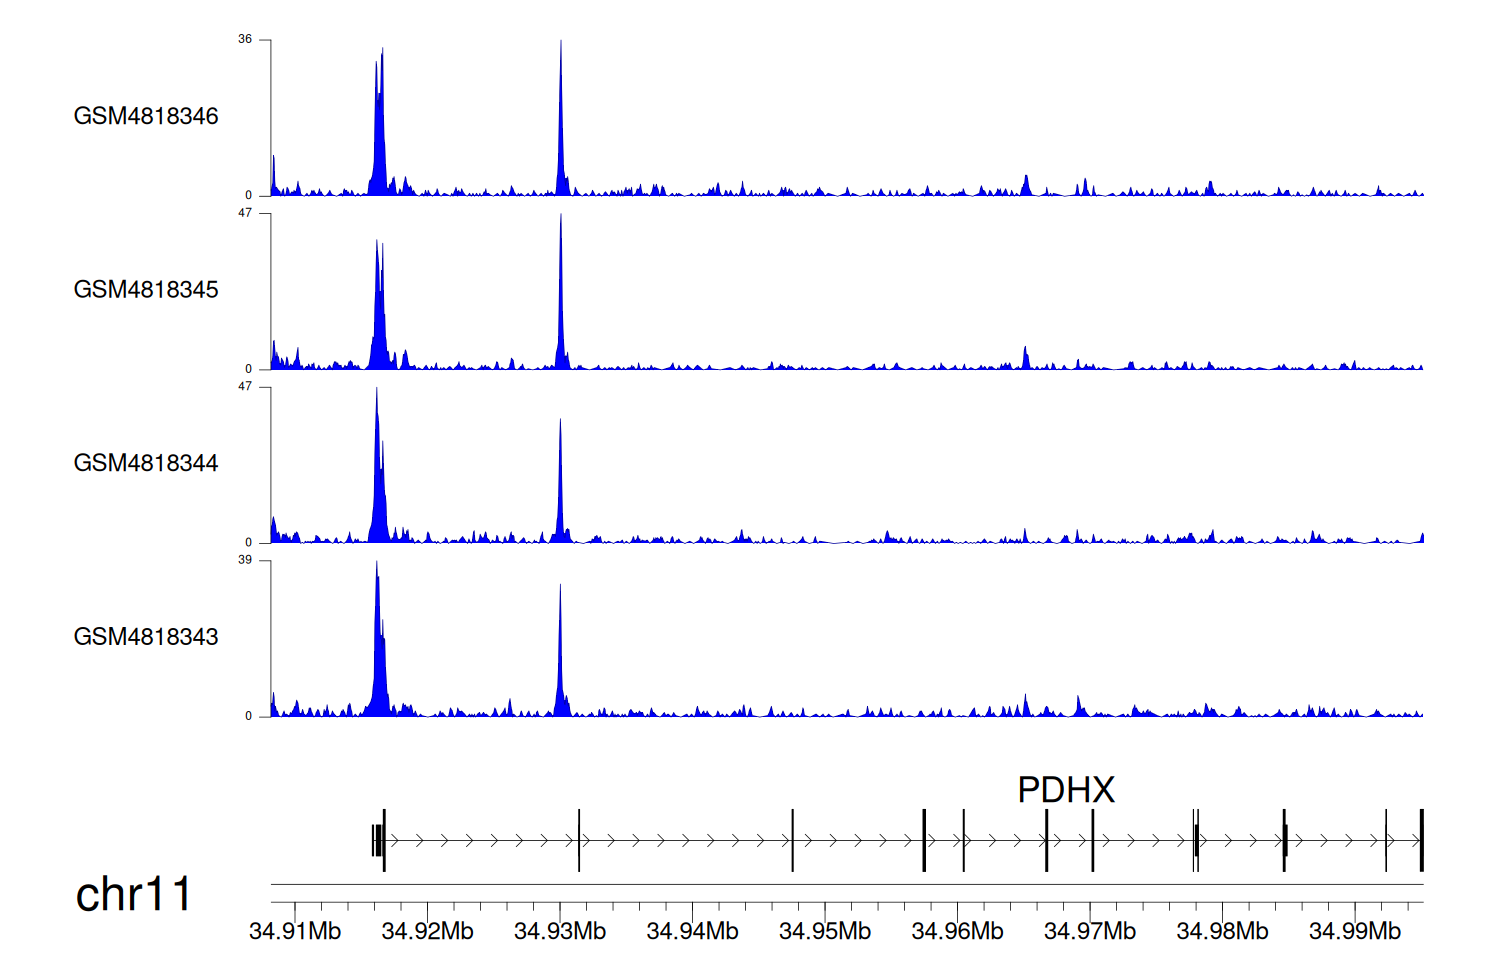
> Dataset: GSE35465 - PDHX peak across samples
|
Peak Plot
|
> Dataset: GSE68402 - PDHX peak across samples
|
Peak Plot
|
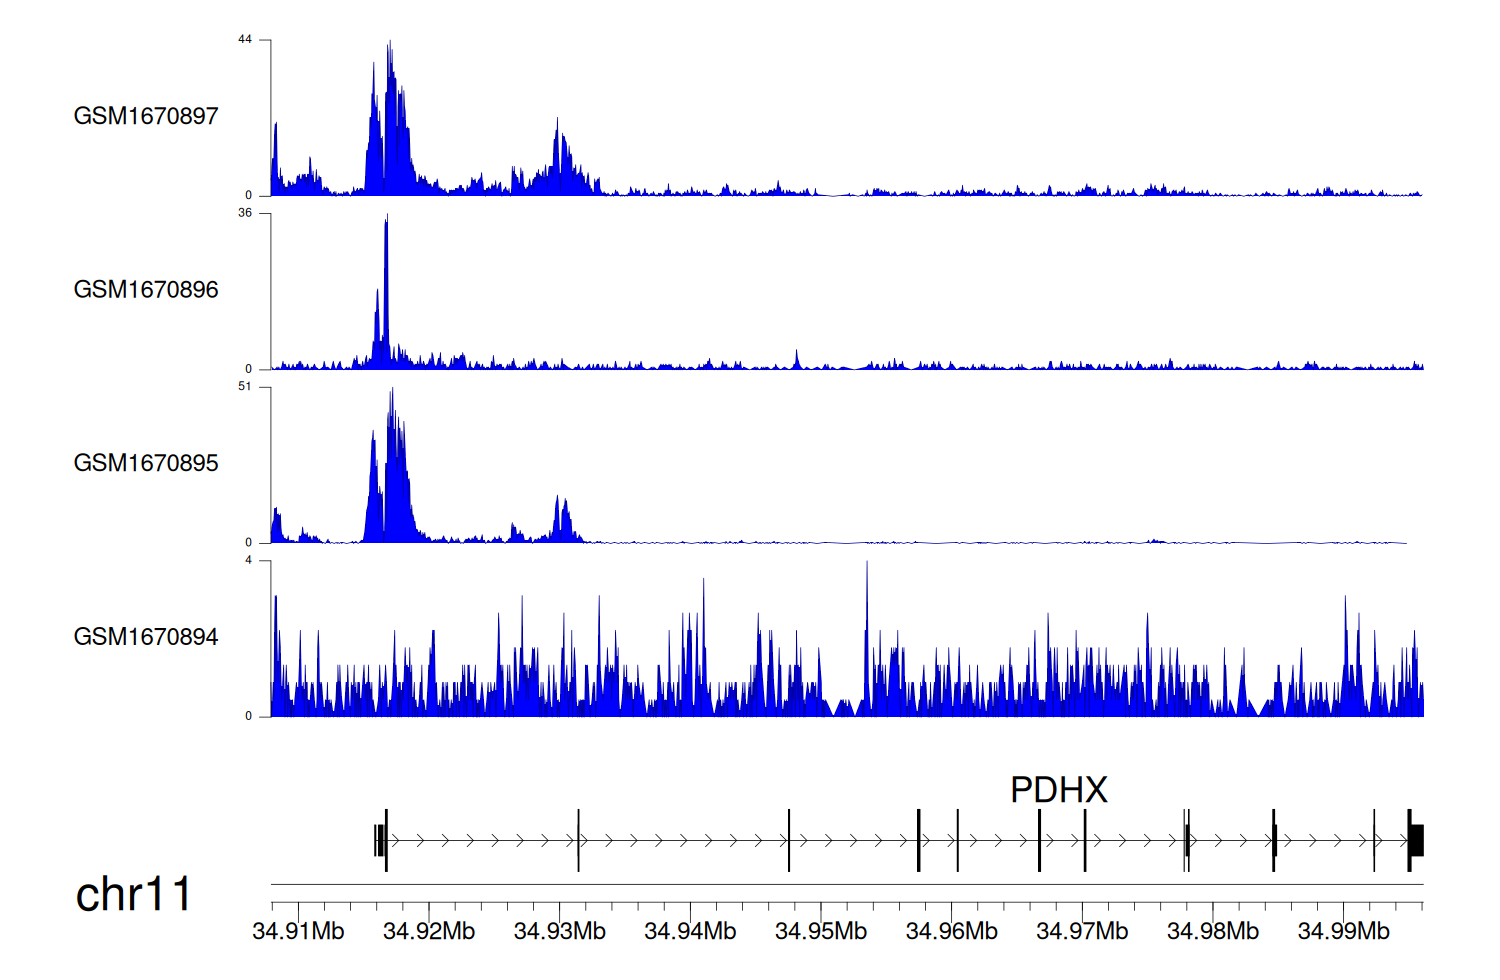
> Dataset: GSE270130 - PDHX peak across samples
|
Peak Plot
|
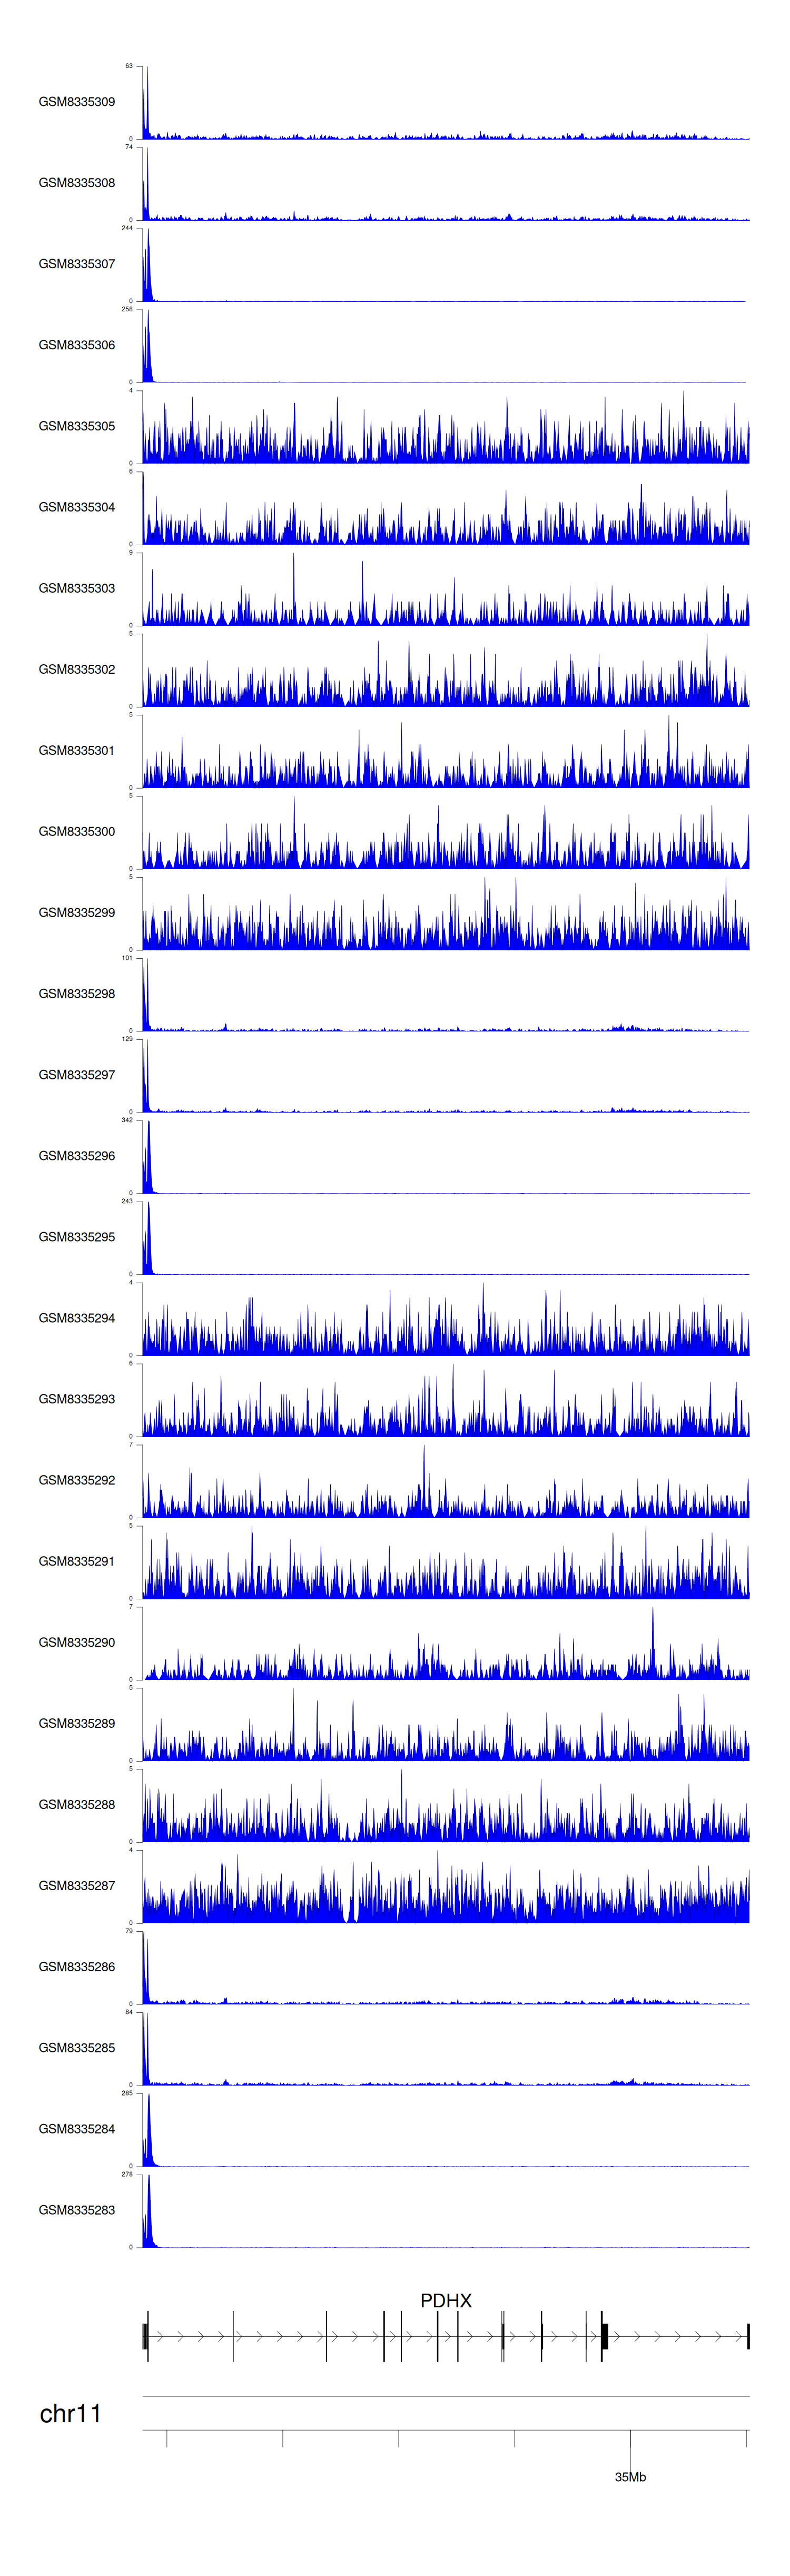
> Dataset: GSE100400 - PDHX peak across samples
|
Peak Plot
|
> Dataset: GSE131257 - PDHX peak across samples
|
Peak Plot
|
|
|
