Gene Information
|
Gene Name
|
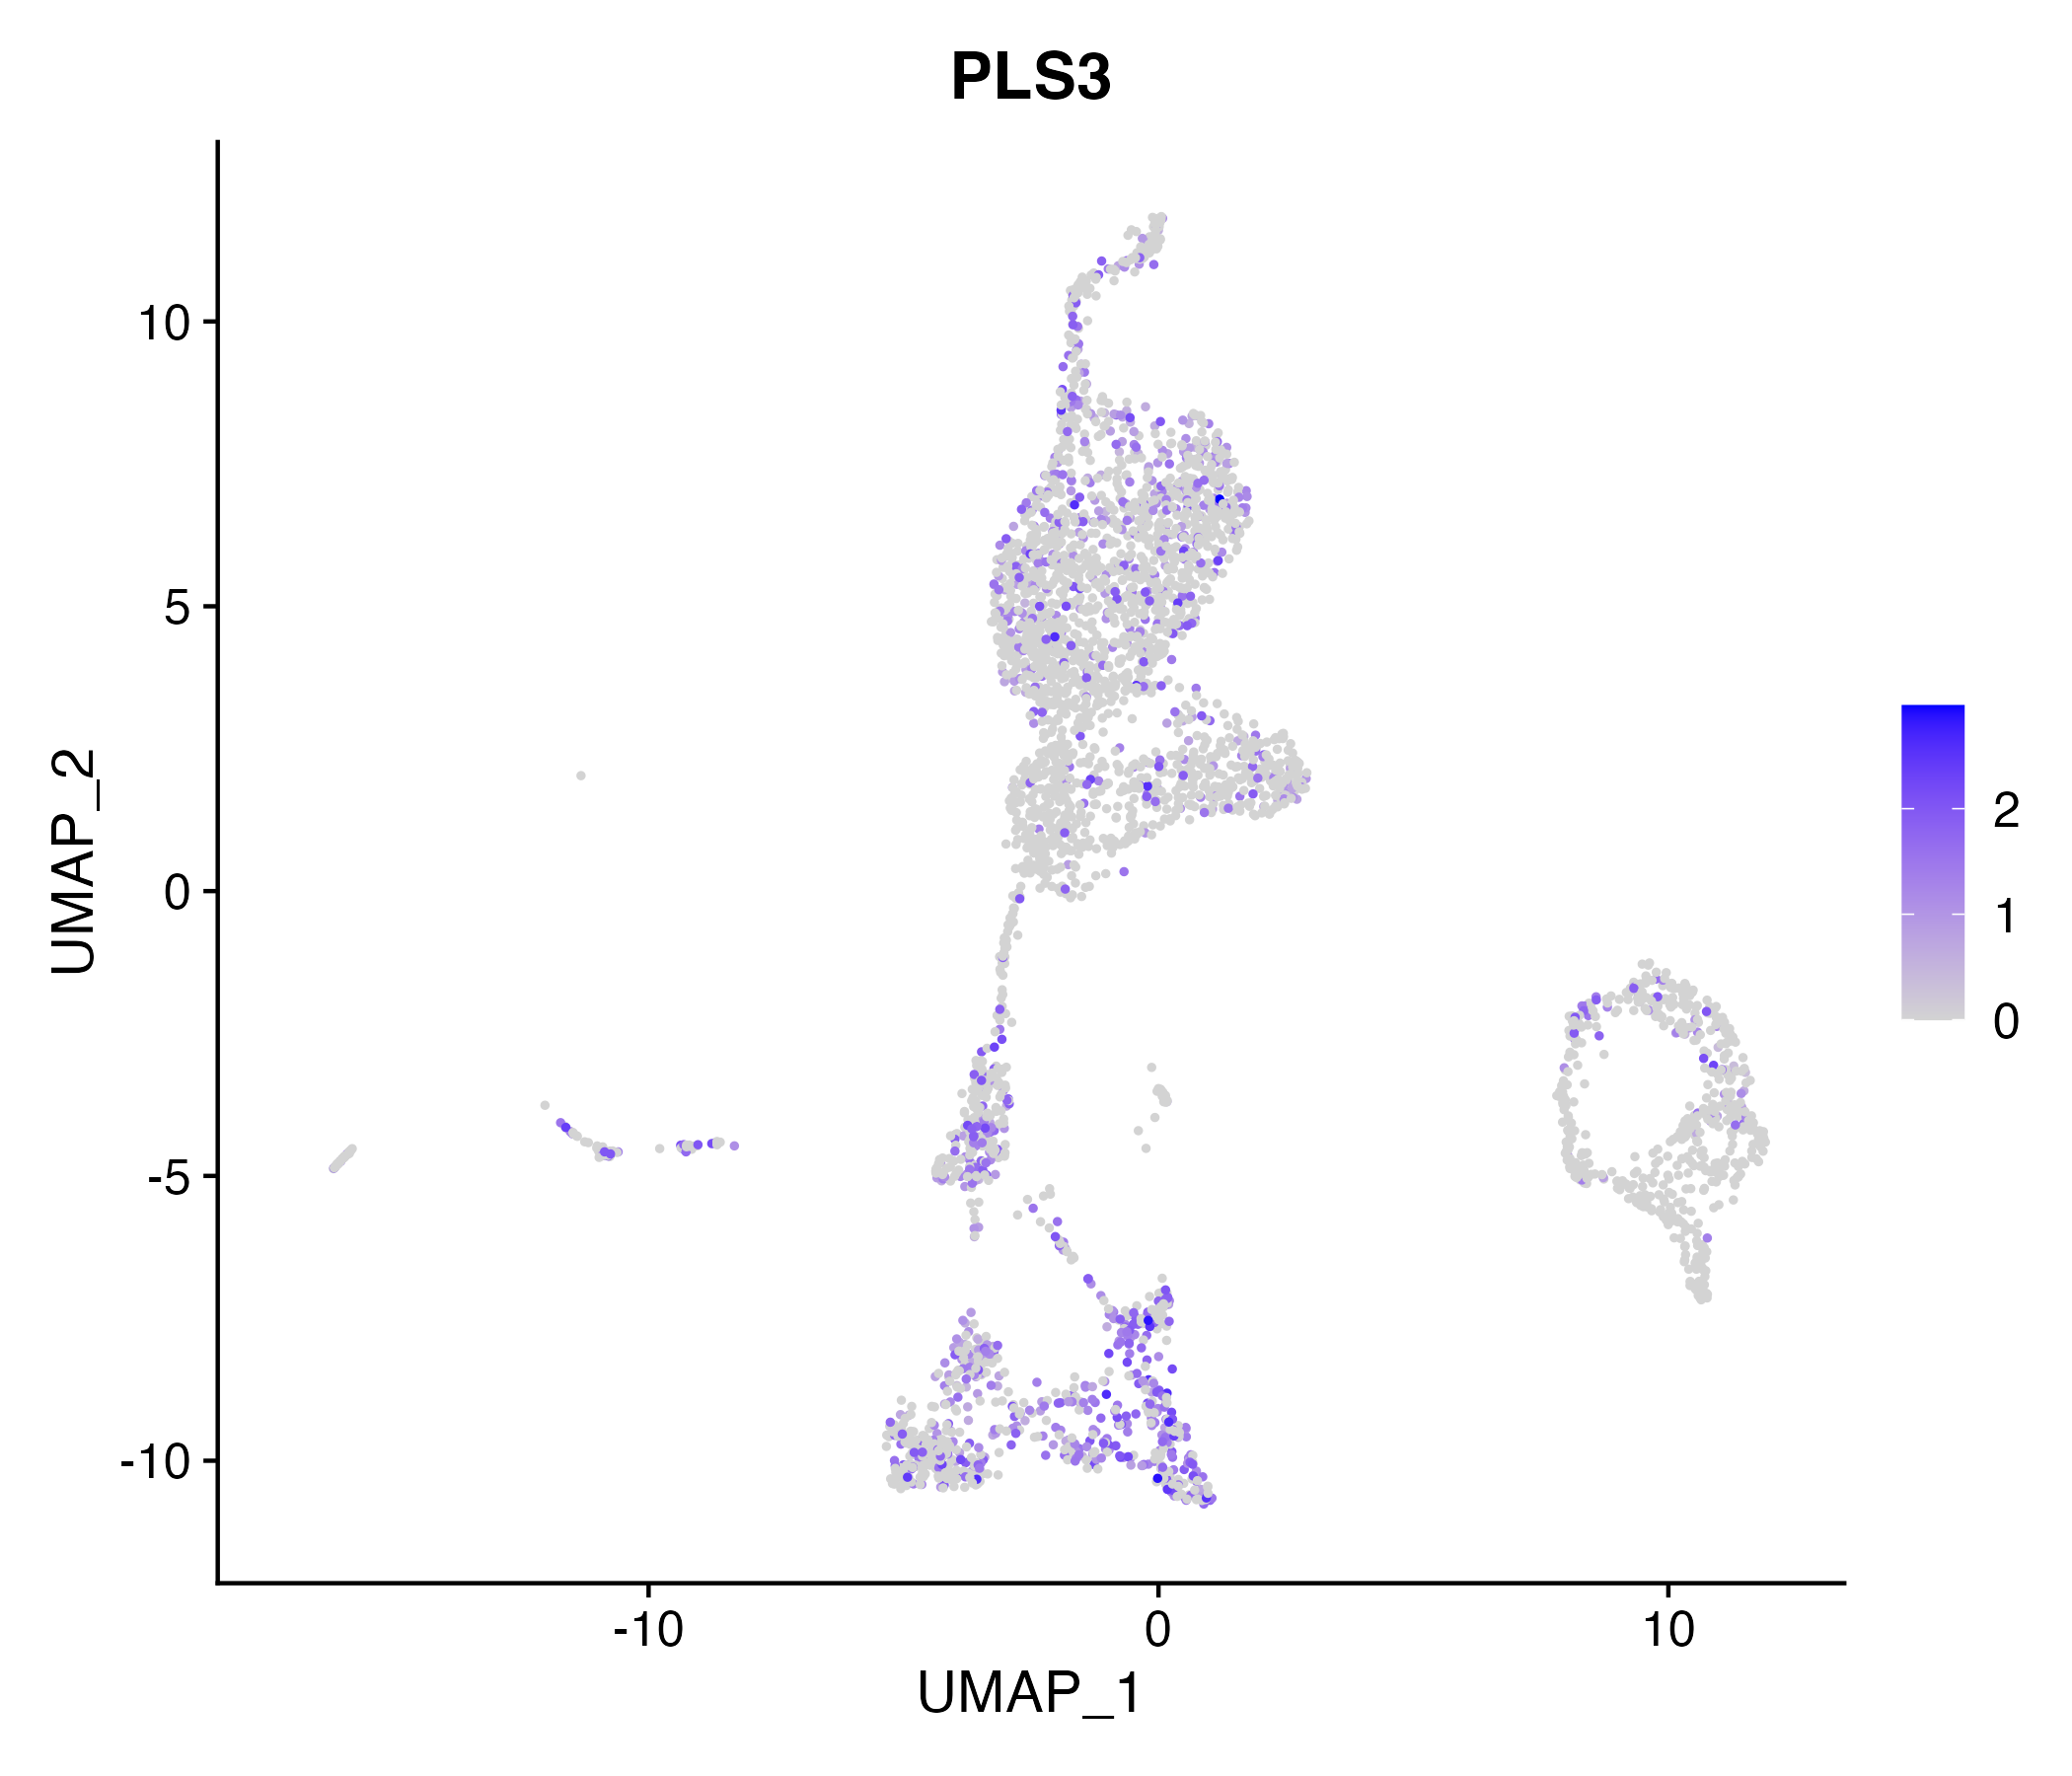
PLS3 |
|
Gene ID
|
5358
|
|
Gene Full Name
|
plastin 3 |
|
Gene Alias
|
BMND18|DIH5|T-plastin |
|
Transcripts
|
ENSG00000102024
|
|
Virus
|
HBV |
|
Gene Type
|
protein-coding |
|
HPA Location Info
|
Plasma membrane, Cytosol; 
|
|
Membrane Info
|
Disease related genes, Human disease related genes, Plasma proteins, Predicted intracellular proteins |
|
Uniport_ID
|
P13797
|
|
HGNC ID
|
HGNC:9091
|
|
OMIM ID
|
300131 |
|
Summary
|
Plastins are a family of actin-binding proteins that are conserved throughout eukaryote evolution and expressed in most tissues of higher eukaryotes. In humans, two ubiquitous plastin isoforms (L and T) have been identified. Plastin 1 (otherwise known as Fimbrin) is a third distinct plastin isoform which is specifically expressed at high levels in the small intestine. The L isoform is expressed only in hemopoietic cell lineages, while the T isoform has been found in all other normal cells of solid tissues that have replicative potential (fibroblasts, endothelial cells, epithelial cells, melanocytes, etc.). The C-terminal 570 amino acids of the T-plastin and L-plastin proteins are 83% identical. It contains a potential calcium-binding site near the N terminus. Alternate splicing results in multiple transcript variants.[provided by RefSeq, Feb 2010] |
Target gene [PLS3] related to VISs 
Integration Table: if previous studies reported that target gene was altered by virus integration events, the overlap between VISs in this literature and Cistrome factors was listed in this section
| DVID |
Chromosome |
HM |
TFBS |
CA |
Sum of Overlapped Records |
Detail |
| 1007593 |
chrX |
13 |
9 |
4 |
26 |
View |
Target gene [PLS3] related to Omics data
| Data ID |
Experiment type |
Sample number |
Platform |
|
GSE236281
|
RNA-seq |
12 |
Illumina MiSeq (Homo sapiens) |
|
C GSE35465
|
Chip-seq;RNA-seq |
6 |
Illumina HiSeq 2000 (Homo sapiens) |
|
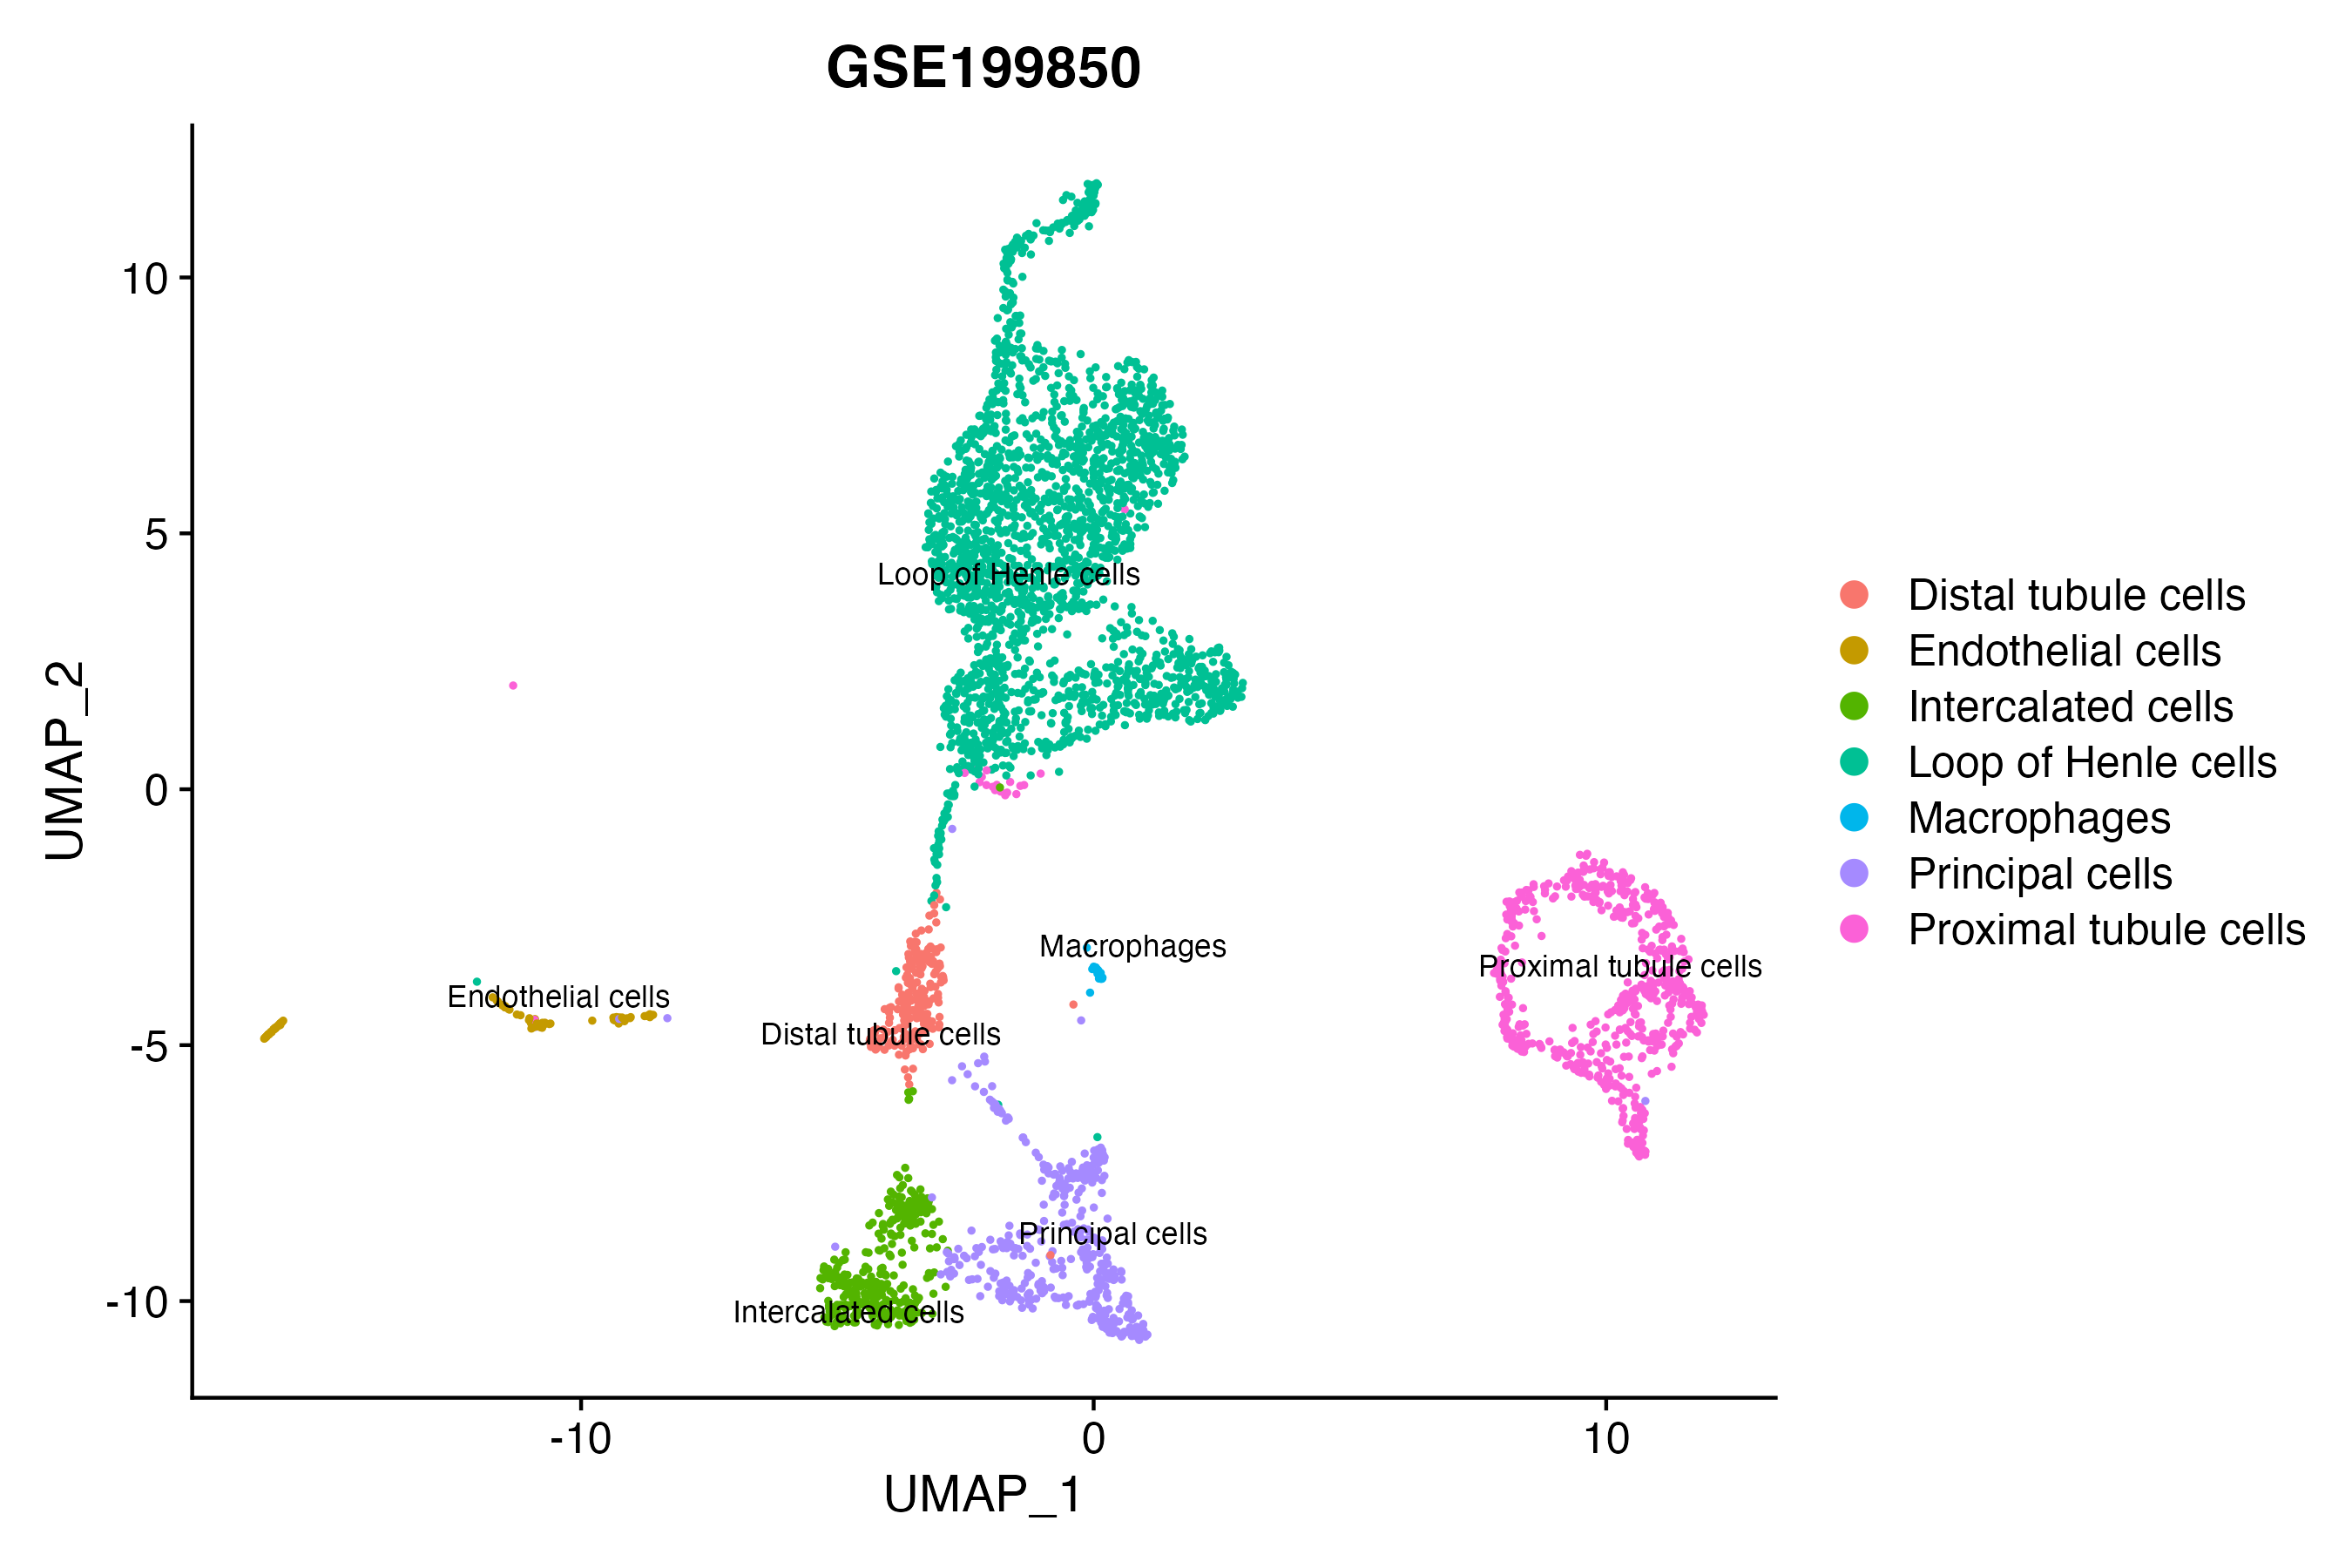
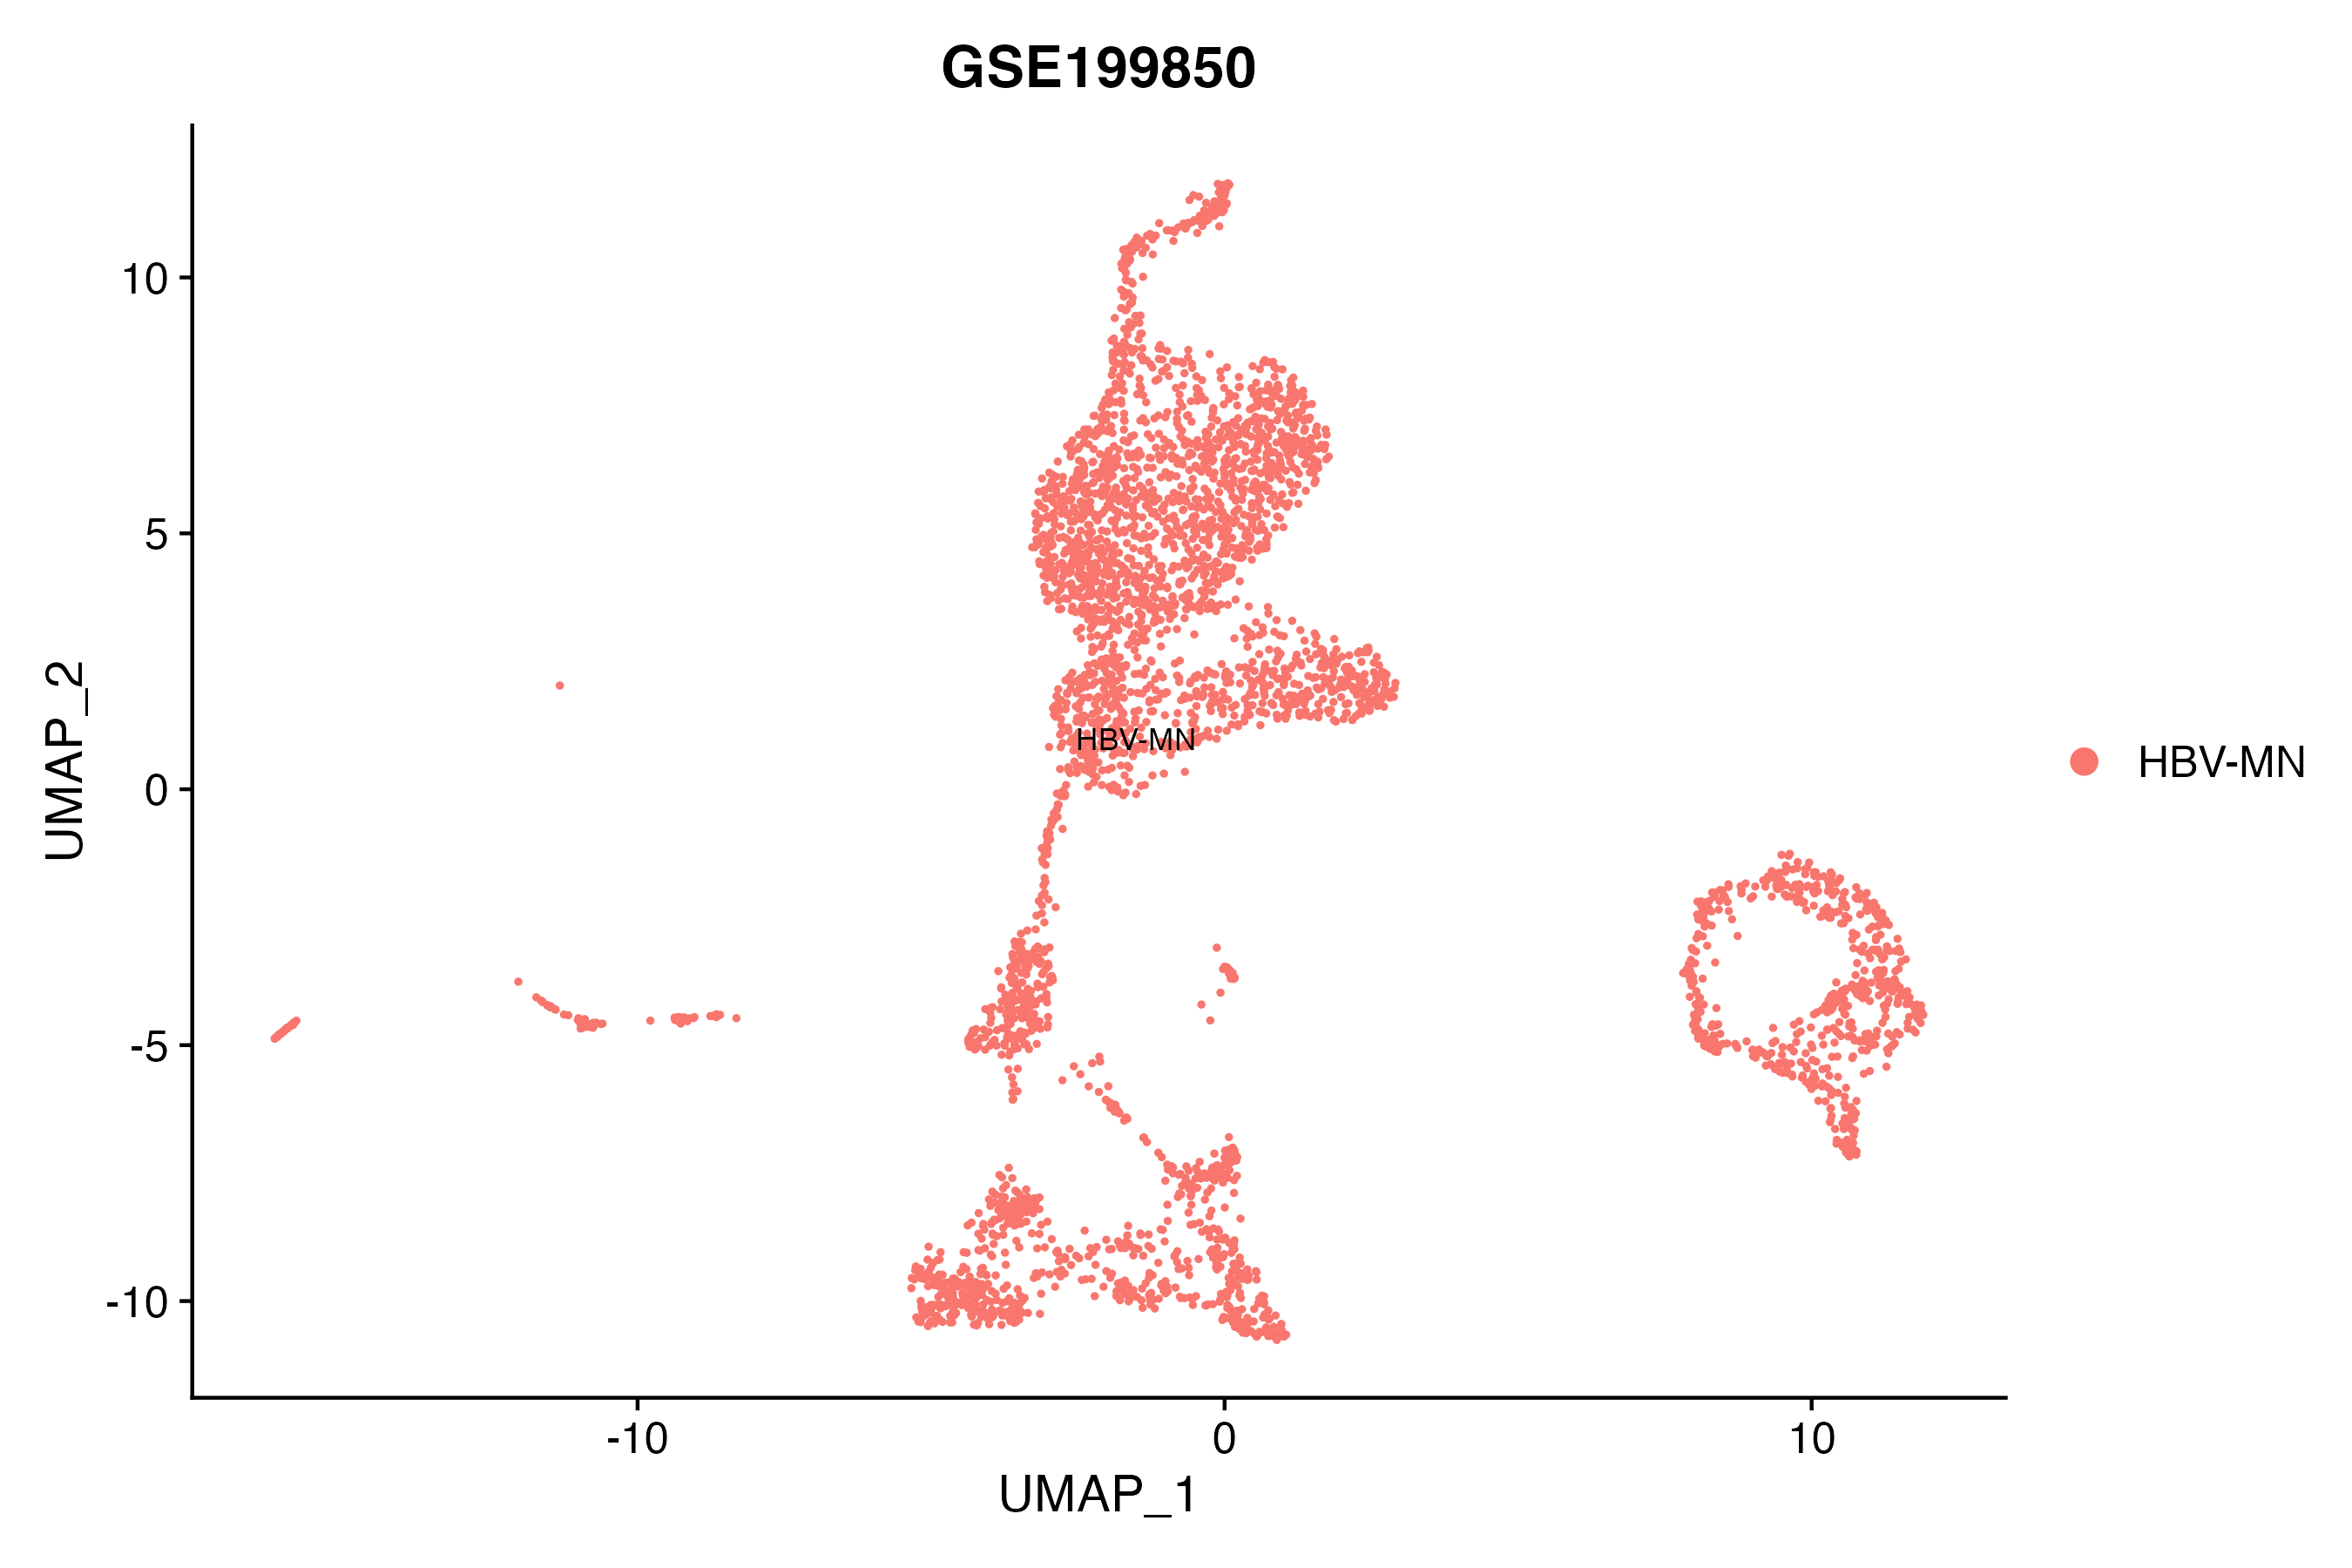
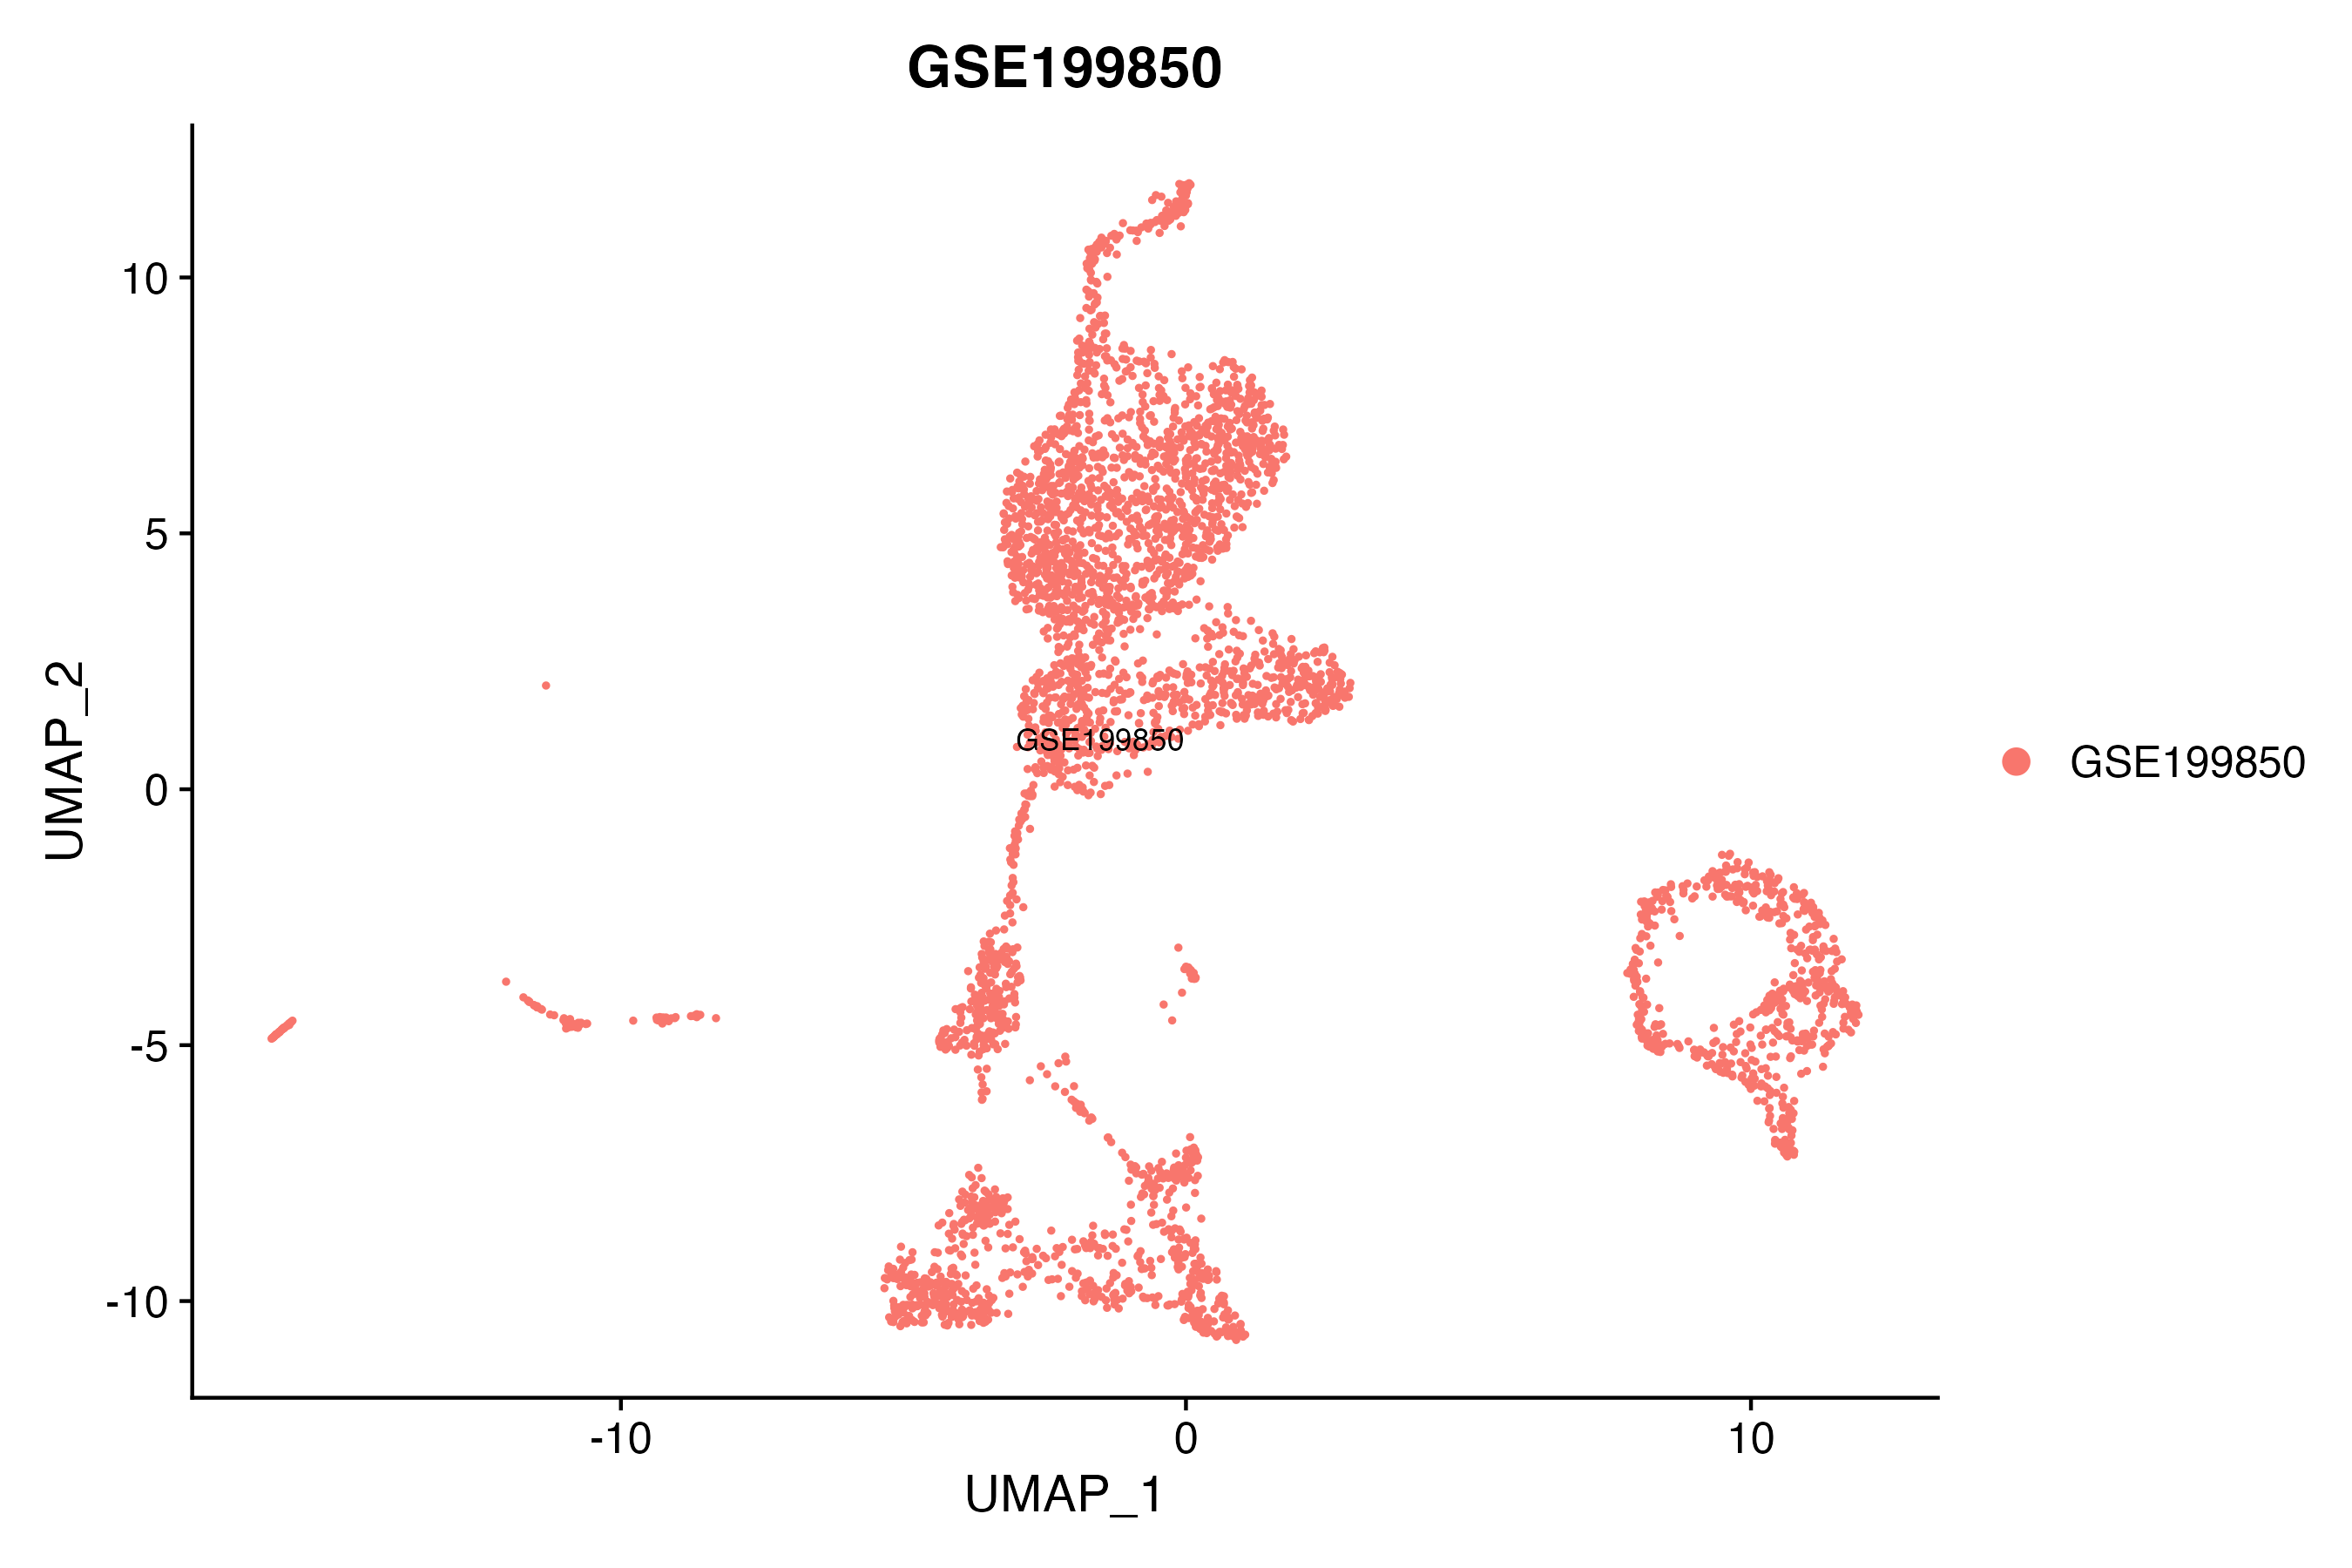
S GSE199850
|
scRNA-seq |
1 |
HiSeq X Ten (Homo sapiens) |
|
C GSE68402
|
Chip-seq |
26 |
Illumina MiSeq (Homo sapiens);Illumina HiSeq 2500 (Homo sapiens) |
|
TCGA_LIHC_HBV
|
DNA methylation sequencing;RNA-seq |
97 |
TCGA |
|
C GSE270130
|
Chip-seq |
27 |
Illumina NovaSeq 6000 (Homo sapiens) |
|
GSE224901
|
RNA-seq |
21 |
Illumina NovaSeq 6000 (Homo sapiens) |
|
C GSE100400
|
Chip-seq;RNA-seq;4C_cccDNA |
31 |
Illumina NextSeq 500 (Homo sapiens);Illumina NextSeq 500 (Mus musculus) |
|
GSE173897
|
RNA-seq |
95 |
Illumina HiSeq 4000 (Homo sapiens) |
|
GSE262515
|
RNA-seq |
21 |
Illumina HiSeq 2500 (Homo sapiens);Illumina HiSeq 2500 (Mus musculus) |
|
GSE110345
|
RNA-seq |
4 |
Illumina HiSeq 2500 (Homo sapiens) |
|
C GSE131257
|
ATAC-seq;RNA-seq |
19 |
Illumina HiSeq 2500 (Homo sapiens) |
|
GSE94660
|
RNA-seq |
42 |
Illumina HiSeq 2500 (Homo sapiens) |
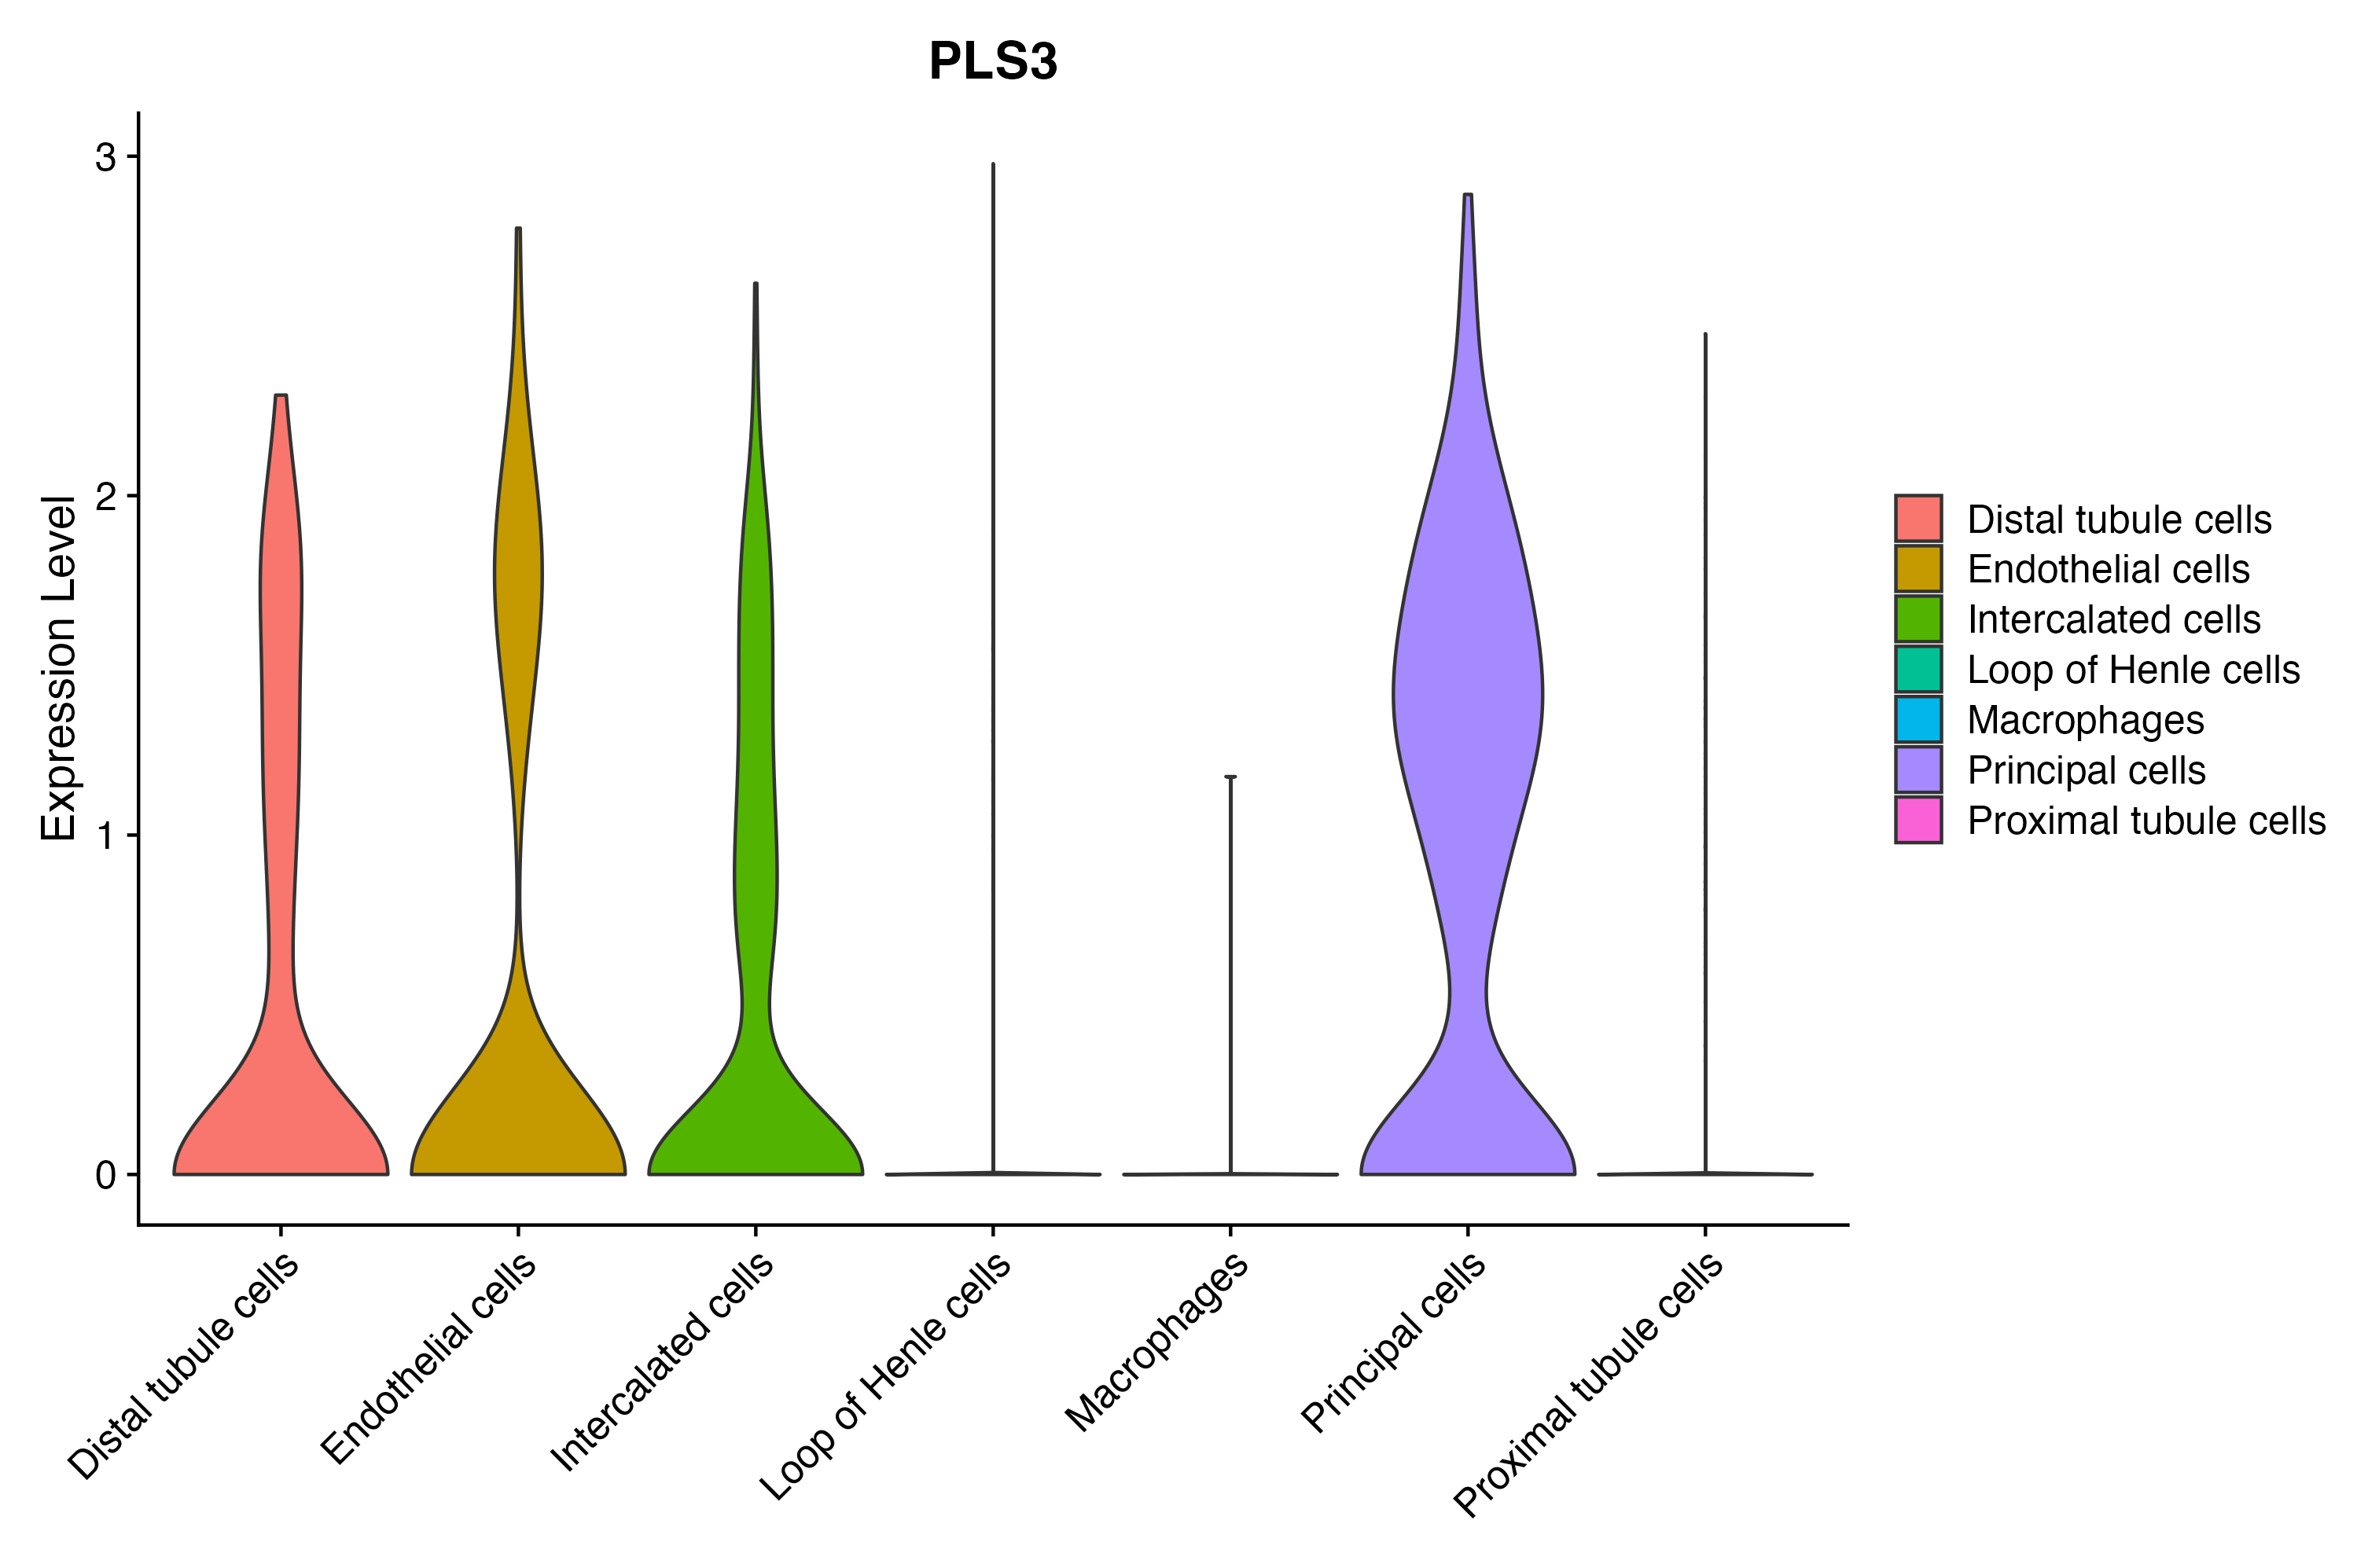
When the query gene is differentially changed in the dataset, a feature/violin plot will be displayed.
> Dataset: GSE199850 - Gene expression in cell subsets
|
|
|
|
|
|
|
|
