Gene Information
|
Gene Name
|
PTPRG |
|
Gene ID
|
5793
|
|
Gene Full Name
|
protein tyrosine phosphatase receptor type G |
|
Gene Alias
|
HPTPG|PTPG|R-PTP-GAMMA|RPTPG |
|
Transcripts
|
ENSG00000144724
|
|
Virus
|
HBV |
|
Gene Type
|
protein-coding |
|
HPA Location Info
|
Plasma membrane; 
|
|
Membrane Info
|
Enzymes, Plasma proteins, Predicted membrane proteins |
|
Uniport_ID
|
P23470
|
|
HGNC ID
|
HGNC:9671
|
|
OMIM ID
|
176886 |
|
Summary
|
The protein encoded by this gene is a member of the protein tyrosine phosphatase (PTP) family. PTPs are known to be signaling molecules that regulate a variety of cellular processes including cell growth, differentiation, mitotic cycle, and oncogenic transformation. This PTP possesses an extracellular region, a single transmembrane region, and two tandem intracytoplasmic catalytic domains, and thus represents a receptor-type PTP. The extracellular region of this PTP contains a carbonic anhydrase-like (CAH) domain, which is also found in the extracellular region of PTPRBETA/ZETA. This gene is located in a chromosomal region that is frequently deleted in renal cell carcinoma and lung carcinoma, thus is thought to be a candidate tumor suppressor gene. [provided by RefSeq, Jul 2008] |
Target gene [PTPRG] related to VISs 
Integration Table: if previous studies reported that target gene was altered by virus integration events, the overlap between VISs in this literature and Cistrome factors was listed in this section
| DVID |
Chromosome |
HM |
TFBS |
CA |
Sum of Overlapped Records |
Detail |
| 1015177 |
chr3 |
2 |
0 |
0 |
2 |
View |
| 1017599 |
chr3 |
0 |
0 |
0 |
0 |
View |
| 1017619 |
chr3 |
0 |
0 |
0 |
0 |
View |
| 1020088 |
chr3 |
4 |
0 |
0 |
4 |
View |
| 1023926 |
chr3 |
0 |
0 |
0 |
0 |
View |
| 1023927 |
chr3 |
0 |
0 |
0 |
0 |
View |
| 1042765 |
chr3 |
0 |
0 |
0 |
0 |
View |
Target gene [PTPRG] related to Omics data
| Data ID |
Experiment type |
Sample number |
Platform |
|
GSE236281
|
RNA-seq |
12 |
Illumina MiSeq (Homo sapiens) |
|
C GSE35465
|
Chip-seq;RNA-seq |
6 |
Illumina HiSeq 2000 (Homo sapiens) |
|
GSE199850
|
scRNA-seq |
1 |
HiSeq X Ten (Homo sapiens) |
|
C GSE68402
|
Chip-seq |
26 |
Illumina MiSeq (Homo sapiens);Illumina HiSeq 2500 (Homo sapiens) |
|
TCGA_LIHC_HBV
|
DNA methylation sequencing;RNA-seq |
97 |
TCGA |
|
C GSE270130
|
Chip-seq |
27 |
Illumina NovaSeq 6000 (Homo sapiens) |
|
GSE224901
|
RNA-seq |
21 |
Illumina NovaSeq 6000 (Homo sapiens) |
|
C GSE100400
|
Chip-seq;RNA-seq;4C_cccDNA |
31 |
Illumina NextSeq 500 (Homo sapiens);Illumina NextSeq 500 (Mus musculus) |
|
GSE173897
|
RNA-seq |
95 |
Illumina HiSeq 4000 (Homo sapiens) |
|
GSE262515
|
RNA-seq |
21 |
Illumina HiSeq 2500 (Homo sapiens);Illumina HiSeq 2500 (Mus musculus) |
|
GSE110345
|
RNA-seq |
4 |
Illumina HiSeq 2500 (Homo sapiens) |
|
C GSE131257
|
ATAC-seq;RNA-seq |
19 |
Illumina HiSeq 2500 (Homo sapiens) |
|
E GSE94660
|
RNA-seq |
42 |
Illumina HiSeq 2500 (Homo sapiens) |
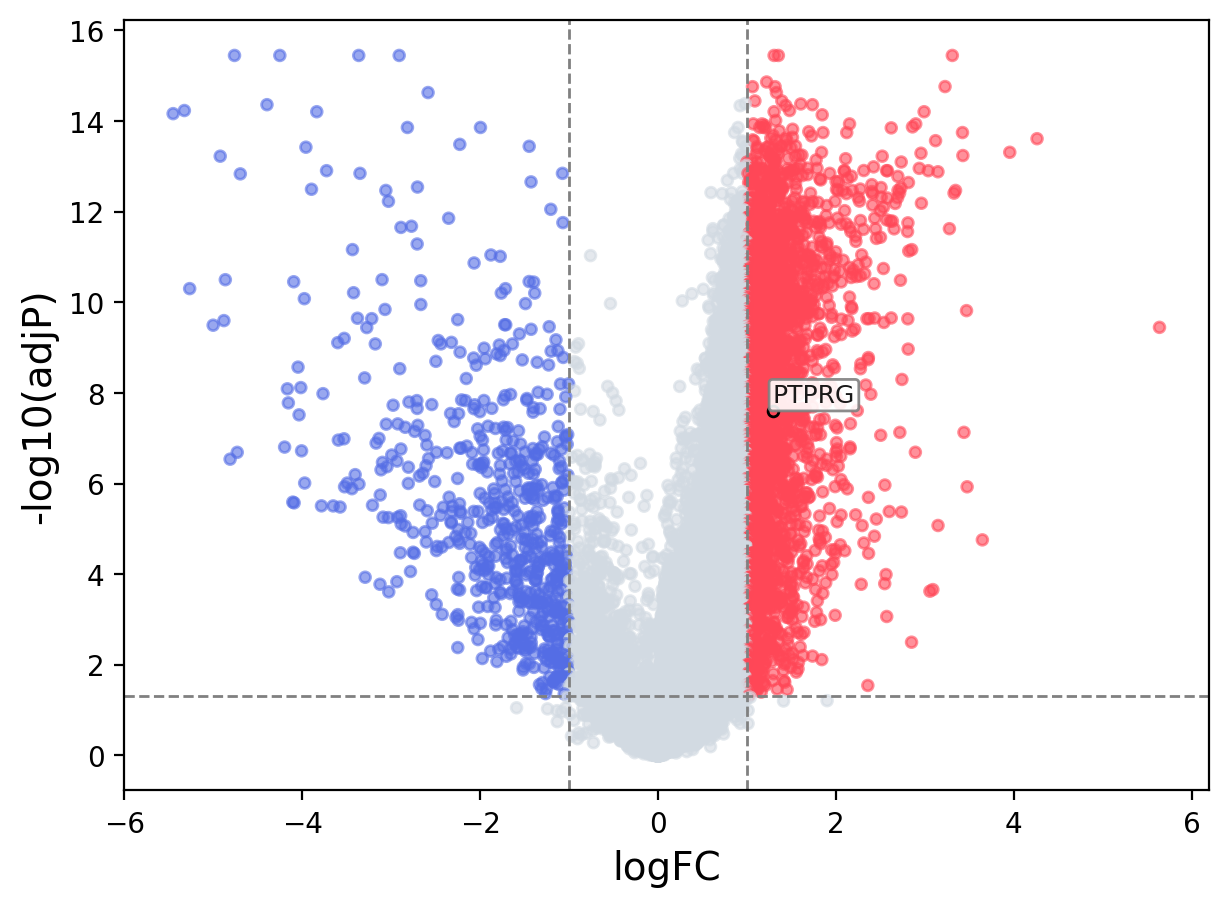
When the query gene is differentially changed in the dataset, a volcano/bar plot will be displayed.
> Dataset: GSE94660 - PTPRG expression across samples
|
Volcano Plot
|
Bar Plot
|
|
|
