Gene Information
|
Gene Name
|
PTPRT |
|
Gene ID
|
11122
|
|
Gene Full Name
|
protein tyrosine phosphatase receptor type T |
|
Gene Alias
|
R-PTP-T|RPTP-rho|RPTPrho |
|
Transcripts
|
ENSG00000196090
|
|
Virus
|
HBV |
|
Gene Type
|
protein-coding |
|
HPA Location Info
|

|
|
Membrane Info
|
Cancer-related genes, Enzymes, Predicted intracellular proteins, Predicted membrane proteins |
|
Uniport_ID
|
O14522
|
|
HGNC ID
|
HGNC:9682
|
|
OMIM ID
|
608712 |
|
Summary
|
The protein encoded by this gene is a member of the protein tyrosine phosphatase (PTP) family. PTPs are known to be signaling molecules that regulate a variety of cellular processes including cell growth, differentiation, mitotic cycle, and oncogenic transformation. This PTP possesses an extracellular region, a single transmembrane region, and two tandem intracellular catalytic domains, and thus represents a receptor-type PTP. The extracellular region contains a meprin-A5 antigen-PTP (MAM) domain, Ig-like and fibronectin type III-like repeats. The protein domain structure and the expression pattern of the mouse counterpart of this PTP suggest its roles in both signal transduction and cellular adhesion in the central nervous system. Two alternatively spliced transcript variants of this gene, which encode distinct proteins, have been reported. [provided by RefSeq, Jul 2008] |
Target gene [PTPRT] related to VISs 
Integration Table: if previous studies reported that target gene was altered by virus integration events, the overlap between VISs in this literature and Cistrome factors was listed in this section
| DVID |
Chromosome |
HM |
TFBS |
CA |
Sum of Overlapped Records |
Detail |
| 1005305 |
chr20 |
0 |
0 |
56 |
56 |
View |
| 1012335 |
chr20 |
7 |
0 |
0 |
7 |
View |
| 1012597 |
chr20 |
5 |
1 |
0 |
6 |
View |
| 1015833 |
chr20 |
1 |
1 |
0 |
2 |
View |
| 1017105 |
chr20 |
1 |
0 |
0 |
1 |
View |
| 1023238 |
chr20 |
0 |
0 |
56 |
56 |
View |
| 1042663 |
chr20 |
2 |
0 |
0 |
2 |
View |
Target gene [PTPRT] related to Omics data
| Data ID |
Experiment type |
Sample number |
Platform |
|
GSE236281
|
RNA-seq |
12 |
Illumina MiSeq (Homo sapiens) |
|
C GSE35465
|
Chip-seq;RNA-seq |
6 |
Illumina HiSeq 2000 (Homo sapiens) |
|
C GSE68402
|
Chip-seq |
26 |
Illumina MiSeq (Homo sapiens);Illumina HiSeq 2500 (Homo sapiens) |
|
TCGA_LIHC_HBV
|
DNA methylation sequencing;RNA-seq |
97 |
TCGA |
|
C GSE270130
|
Chip-seq |
27 |
Illumina NovaSeq 6000 (Homo sapiens) |
|
GSE224901
|
RNA-seq |
21 |
Illumina NovaSeq 6000 (Homo sapiens) |
|
C GSE100400
|
Chip-seq;RNA-seq;4C_cccDNA |
31 |
Illumina NextSeq 500 (Homo sapiens);Illumina NextSeq 500 (Mus musculus) |
|
GSE173897
|
RNA-seq |
95 |
Illumina HiSeq 4000 (Homo sapiens) |
|
GSE262515
|
RNA-seq |
21 |
Illumina HiSeq 2500 (Homo sapiens);Illumina HiSeq 2500 (Mus musculus) |
|
GSE110345
|
RNA-seq |
4 |
Illumina HiSeq 2500 (Homo sapiens) |
|
C GSE131257
|
ATAC-seq;RNA-seq |
19 |
Illumina HiSeq 2500 (Homo sapiens) |
|
GSE94660
|
RNA-seq |
42 |
Illumina HiSeq 2500 (Homo sapiens) |
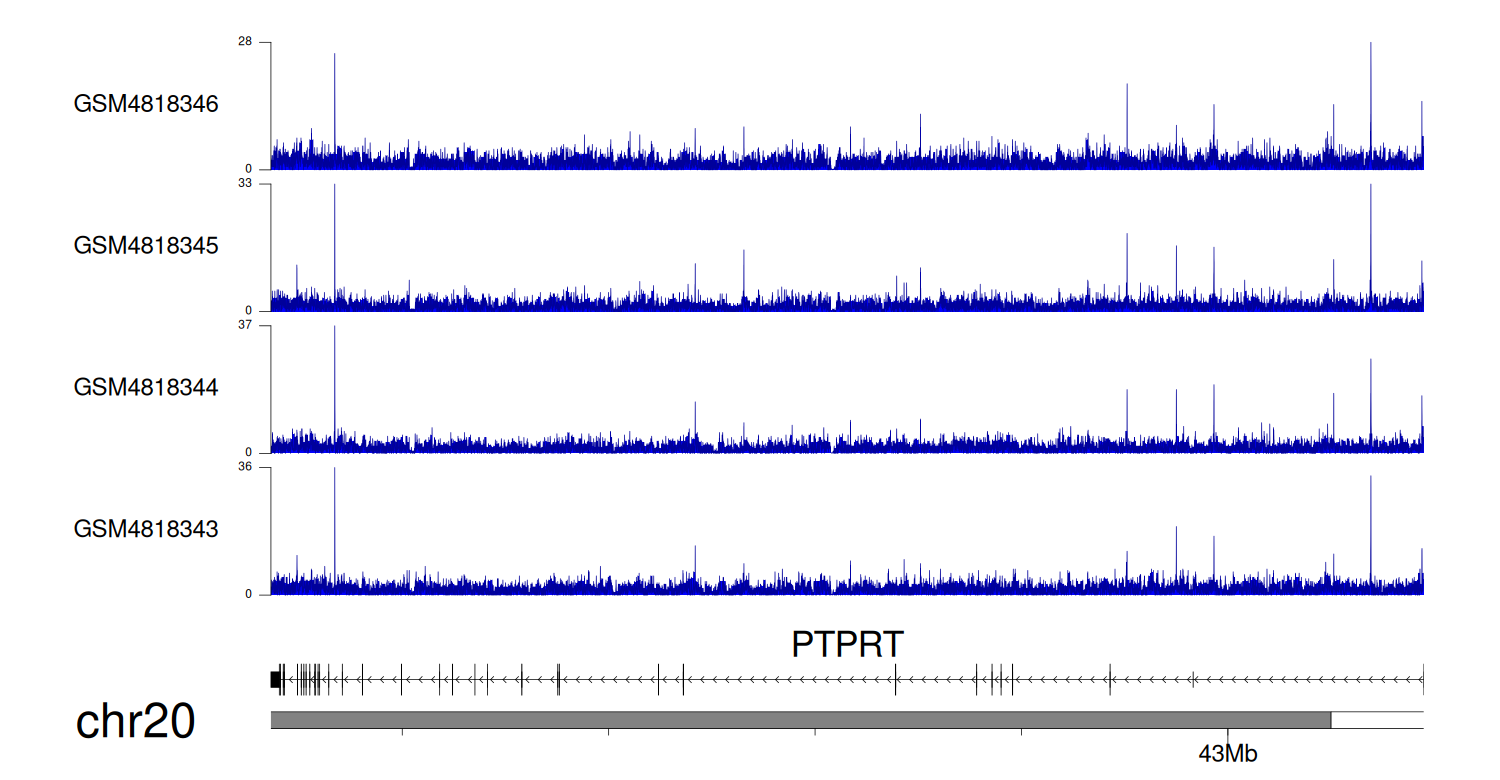
When the gene can detect a peak in the dataset, a peak plot will be displayed.
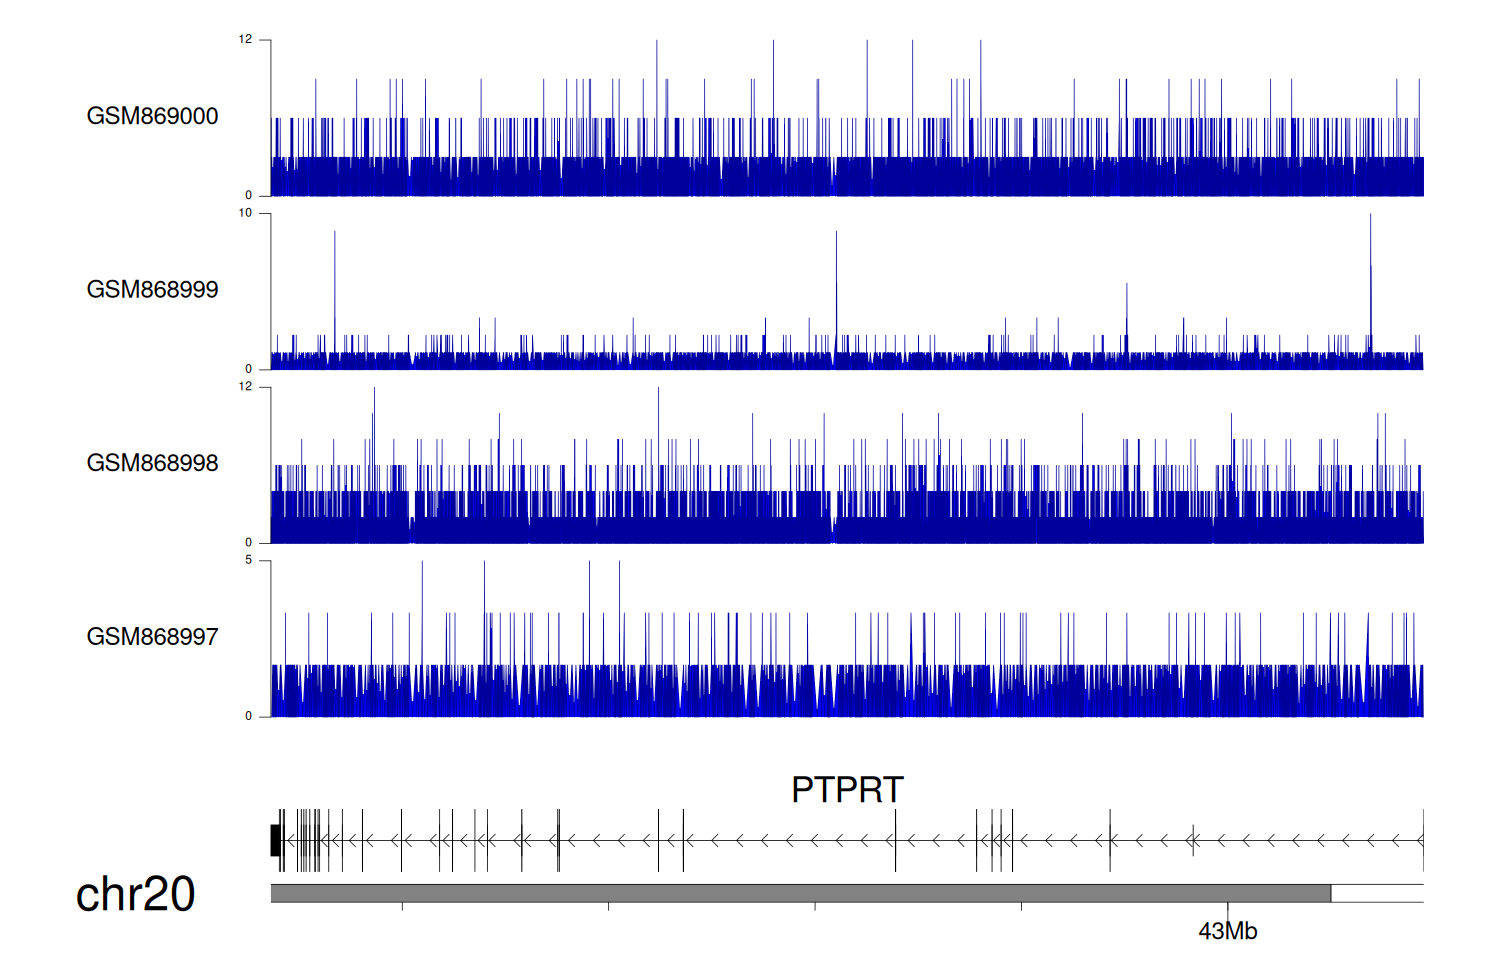
> Dataset: GSE35465 - PTPRT peak across samples
|
Peak Plot
|
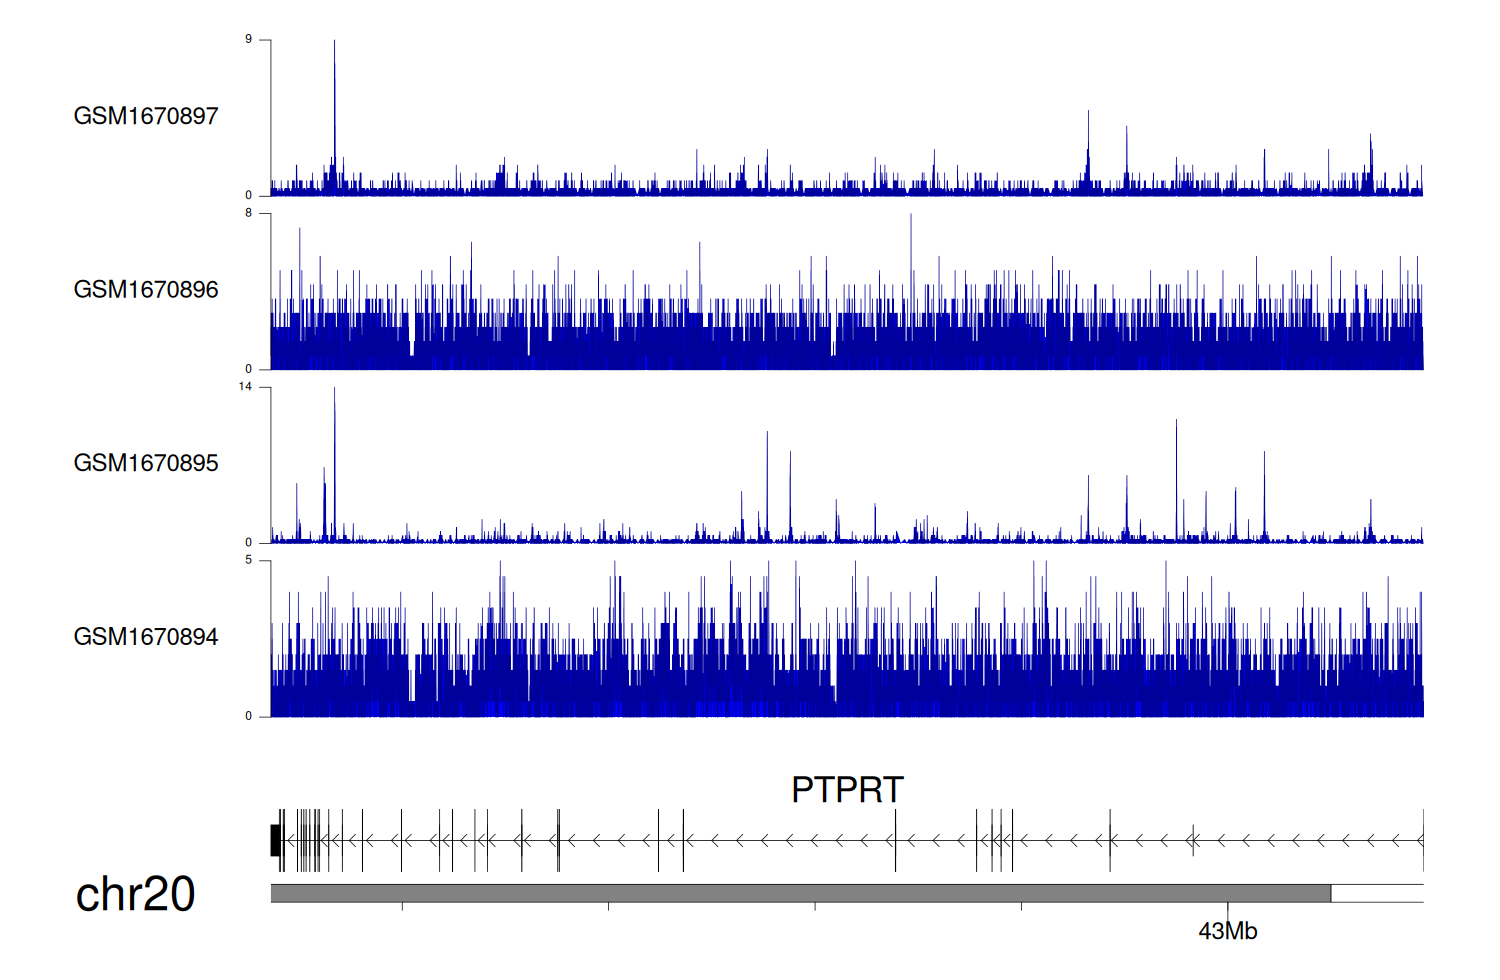
> Dataset: GSE68402 - PTPRT peak across samples
|
Peak Plot
|
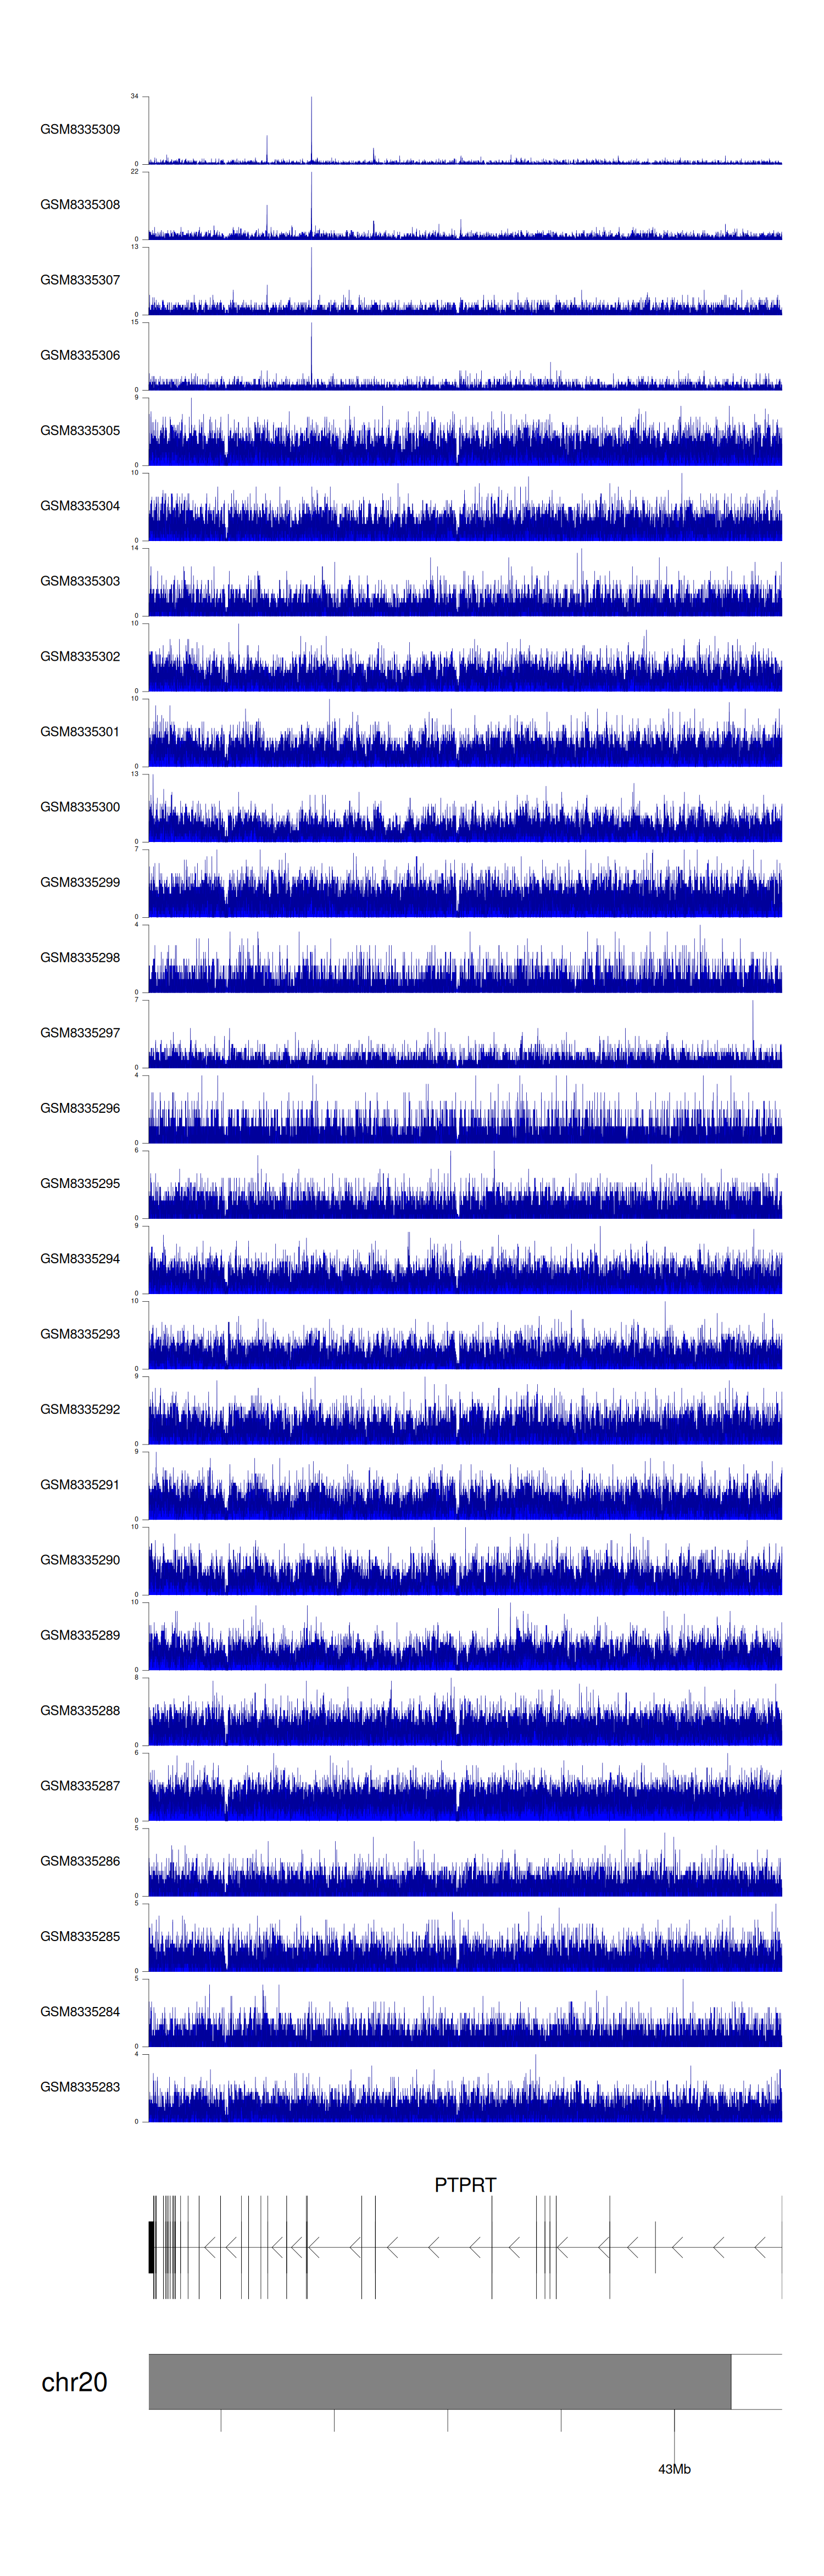
> Dataset: GSE270130 - PTPRT peak across samples
|
Peak Plot
|
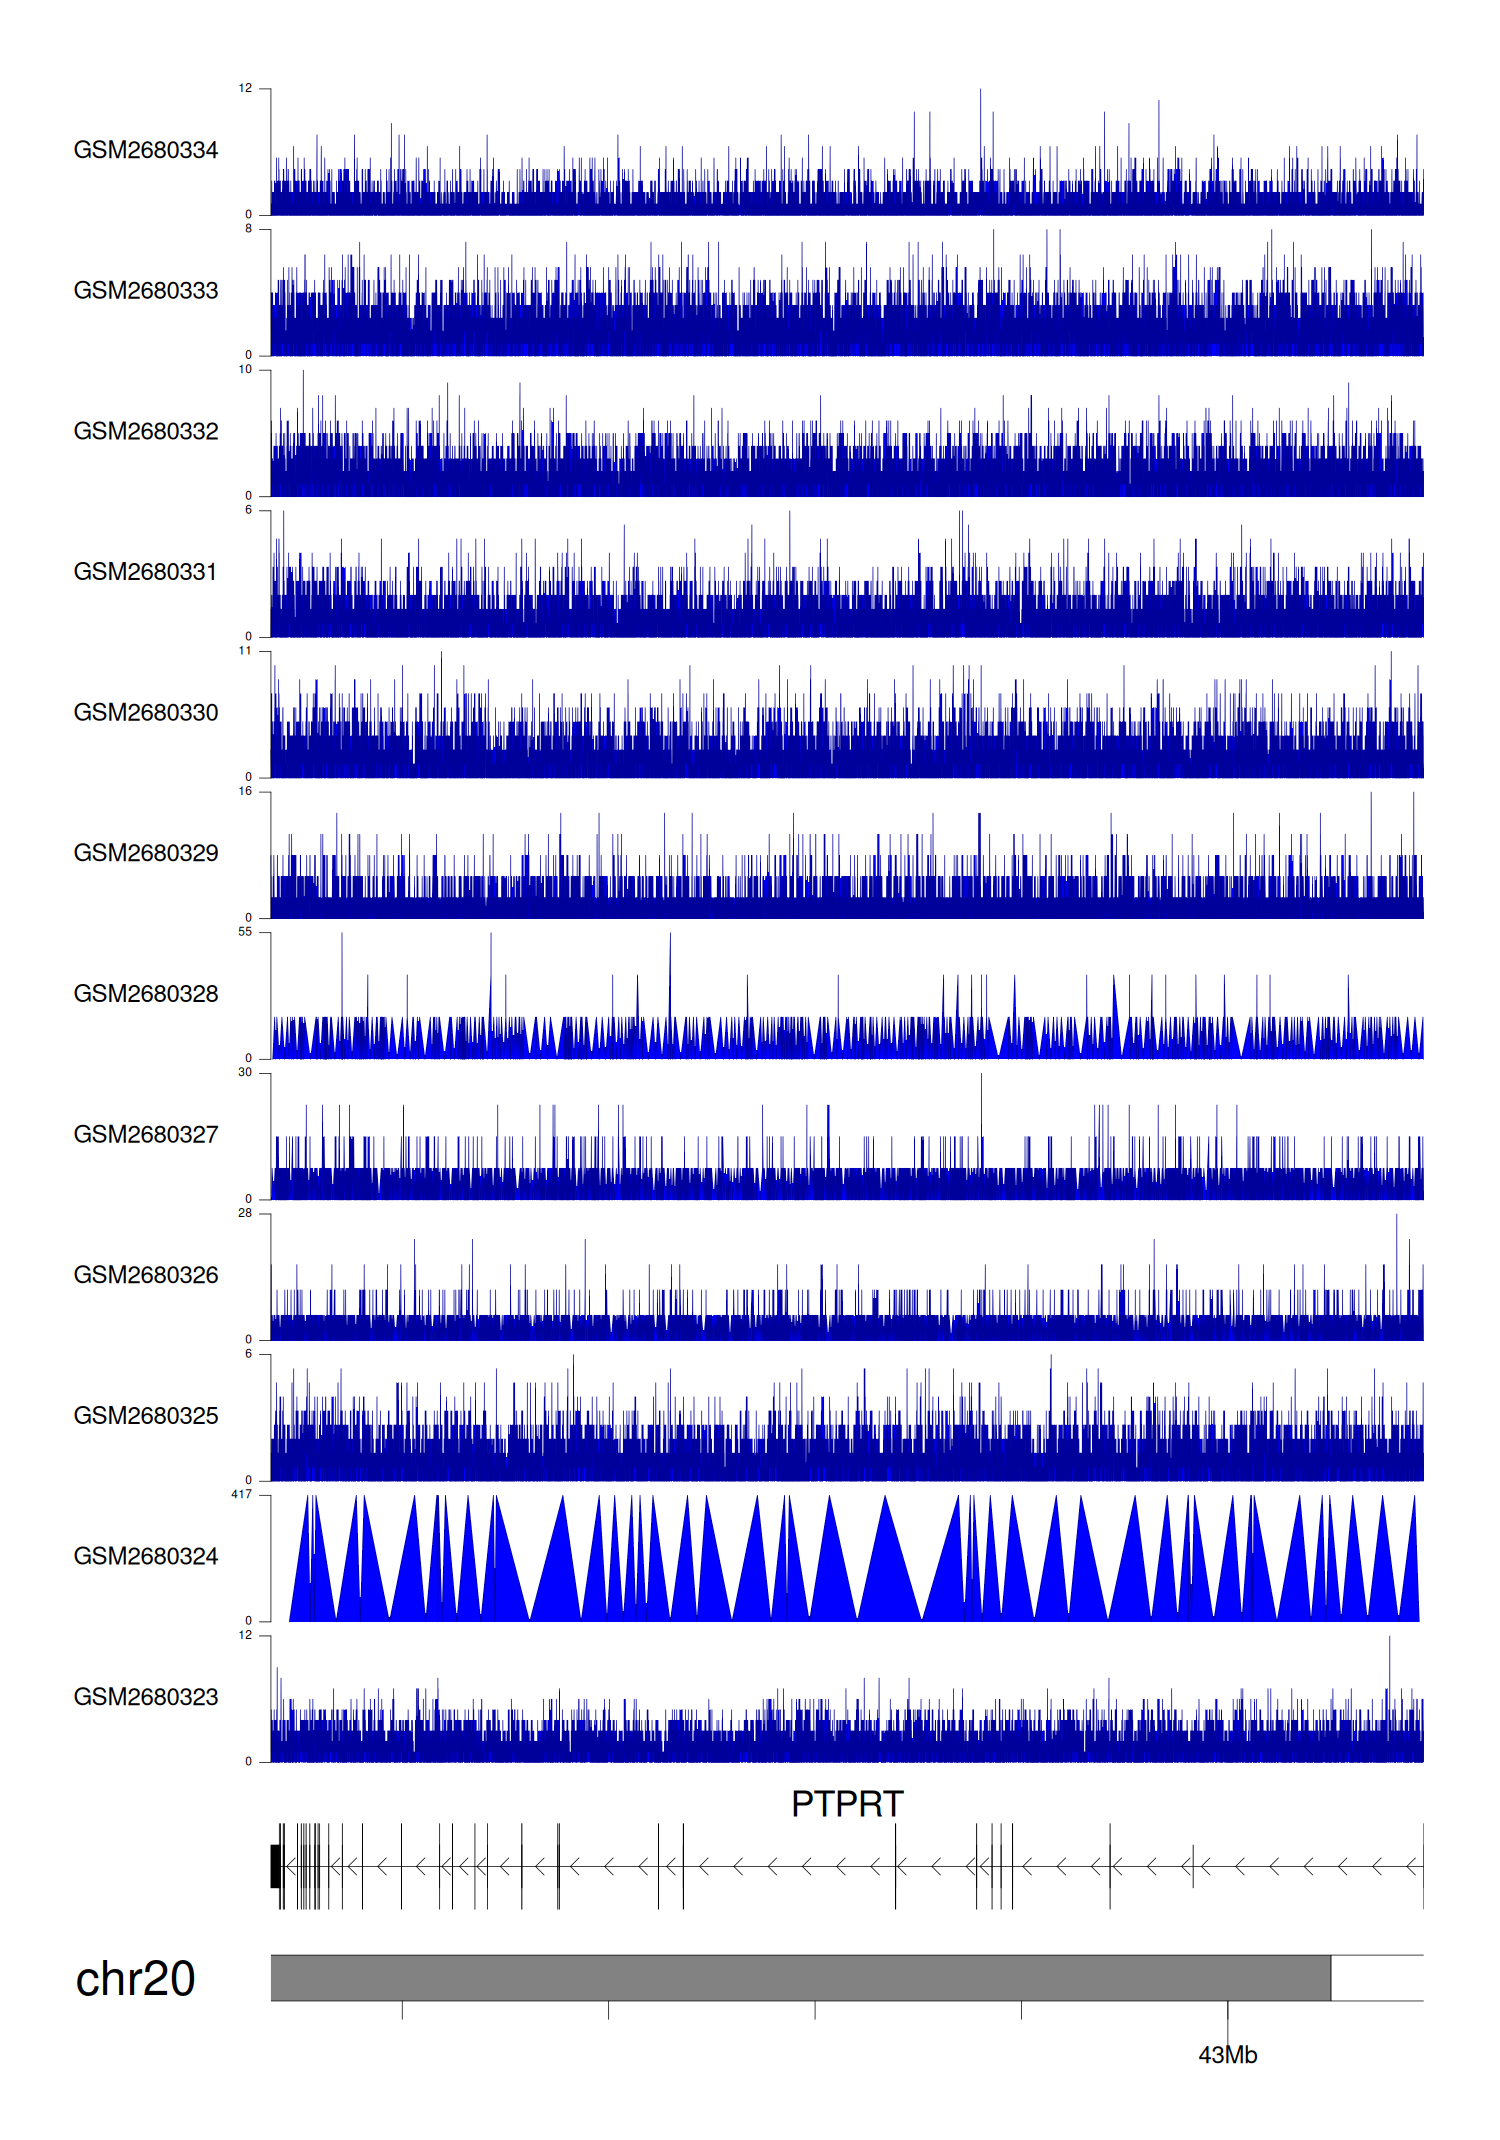
> Dataset: GSE100400 - PTPRT peak across samples
|
Peak Plot
|
> Dataset: GSE131257 - PTPRT peak across samples
|
Peak Plot
|
|
|
