Gene Information
|
Gene Name
|
SCN1A |
|
Gene ID
|
6323
|
|
Gene Full Name
|
sodium voltage-gated channel alpha subunit 1 |
|
Gene Alias
|
DEE6|DEE6A|DEE6B|DRVT|EIEE6|FEB3|FEB3A|FHM3|GEFSP2|HBSCI|NAC1|Nav1.1|SCN1|SMEI |
|
Transcripts
|
ENSG00000144285
|
|
Virus
|
HBV |
|
Gene Type
|
protein-coding |
|
HPA Location Info
|
Nucleoplasm, Plasma membrane;Nuclear bodies; 
|
|
Membrane Info
|
Disease related genes, FDA approved drug targets, Human disease related genes, Predicted intracellular proteins, Predicted membrane proteins, Transporters, Voltage-gated ion channels |
|
Uniport_ID
|
P35498
|
|
HGNC ID
|
HGNC:10585
|
|
OMIM ID
|
182389 |
|
Summary
|
Voltage-dependent sodium channels are heteromeric complexes that regulate sodium exchange between intracellular and extracellular spaces and are essential for the generation and propagation of action potentials in muscle cells and neurons. Each sodium channel is composed of a large pore-forming, glycosylated alpha subunit and two smaller beta subunits. This gene encodes a sodium channel alpha subunit, which has four homologous domains, each of which contains six transmembrane regions. Allelic variants of this gene are associated with generalized epilepsy with febrile seizures and epileptic encephalopathy. Alternative splicing results in multiple transcript variants. The RefSeq Project has decided to create four representative RefSeq records. Three of the transcript variants are supported by experimental evidence and the fourth contains alternate 5' untranslated exons, the exact combination of which have not been experimentally confirmed for the full-length transcript. [provided by RefSeq, Oct 2015] |
Target gene [SCN1A] related to VISs 
Integration Table: if previous studies reported that target gene was altered by virus integration events, the overlap between VISs in this literature and Cistrome factors was listed in this section
| DVID |
Chromosome |
HM |
TFBS |
CA |
Sum of Overlapped Records |
Detail |
| 1042544 |
chr2 |
4 |
0 |
0 |
4 |
View |
Target gene [SCN1A] related to Omics data
| Data ID |
Experiment type |
Sample number |
Platform |
|
GSE236281
|
RNA-seq |
12 |
Illumina MiSeq (Homo sapiens) |
|
C GSE35465
|
Chip-seq;RNA-seq |
6 |
Illumina HiSeq 2000 (Homo sapiens) |
|
C GSE68402
|
Chip-seq |
26 |
Illumina MiSeq (Homo sapiens);Illumina HiSeq 2500 (Homo sapiens) |
|
TCGA_LIHC_HBV
|
DNA methylation sequencing;RNA-seq |
97 |
TCGA |
|
C GSE270130
|
Chip-seq |
27 |
Illumina NovaSeq 6000 (Homo sapiens) |
|
GSE224901
|
RNA-seq |
21 |
Illumina NovaSeq 6000 (Homo sapiens) |
|
C GSE100400
|
Chip-seq;RNA-seq;4C_cccDNA |
31 |
Illumina NextSeq 500 (Homo sapiens);Illumina NextSeq 500 (Mus musculus) |
|
GSE173897
|
RNA-seq |
95 |
Illumina HiSeq 4000 (Homo sapiens) |
|
GSE262515
|
RNA-seq |
21 |
Illumina HiSeq 2500 (Homo sapiens);Illumina HiSeq 2500 (Mus musculus) |
|
GSE110345
|
RNA-seq |
4 |
Illumina HiSeq 2500 (Homo sapiens) |
|
C GSE131257
|
ATAC-seq;RNA-seq |
19 |
Illumina HiSeq 2500 (Homo sapiens) |
|
GSE94660
|
RNA-seq |
42 |
Illumina HiSeq 2500 (Homo sapiens) |
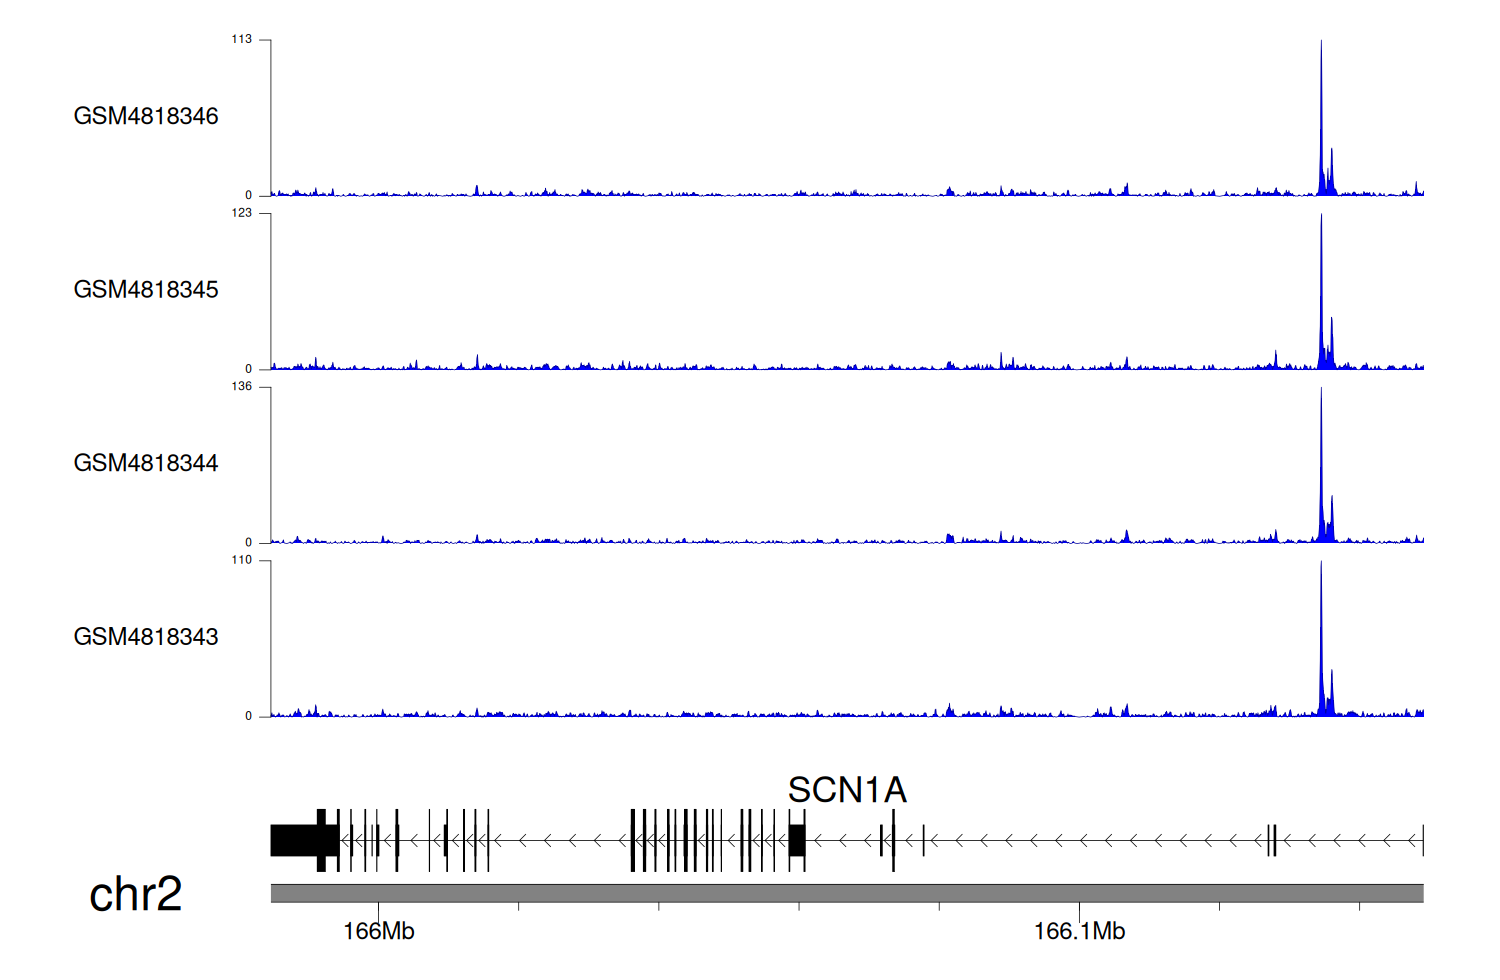
When the gene can detect a peak in the dataset, a peak plot will be displayed.
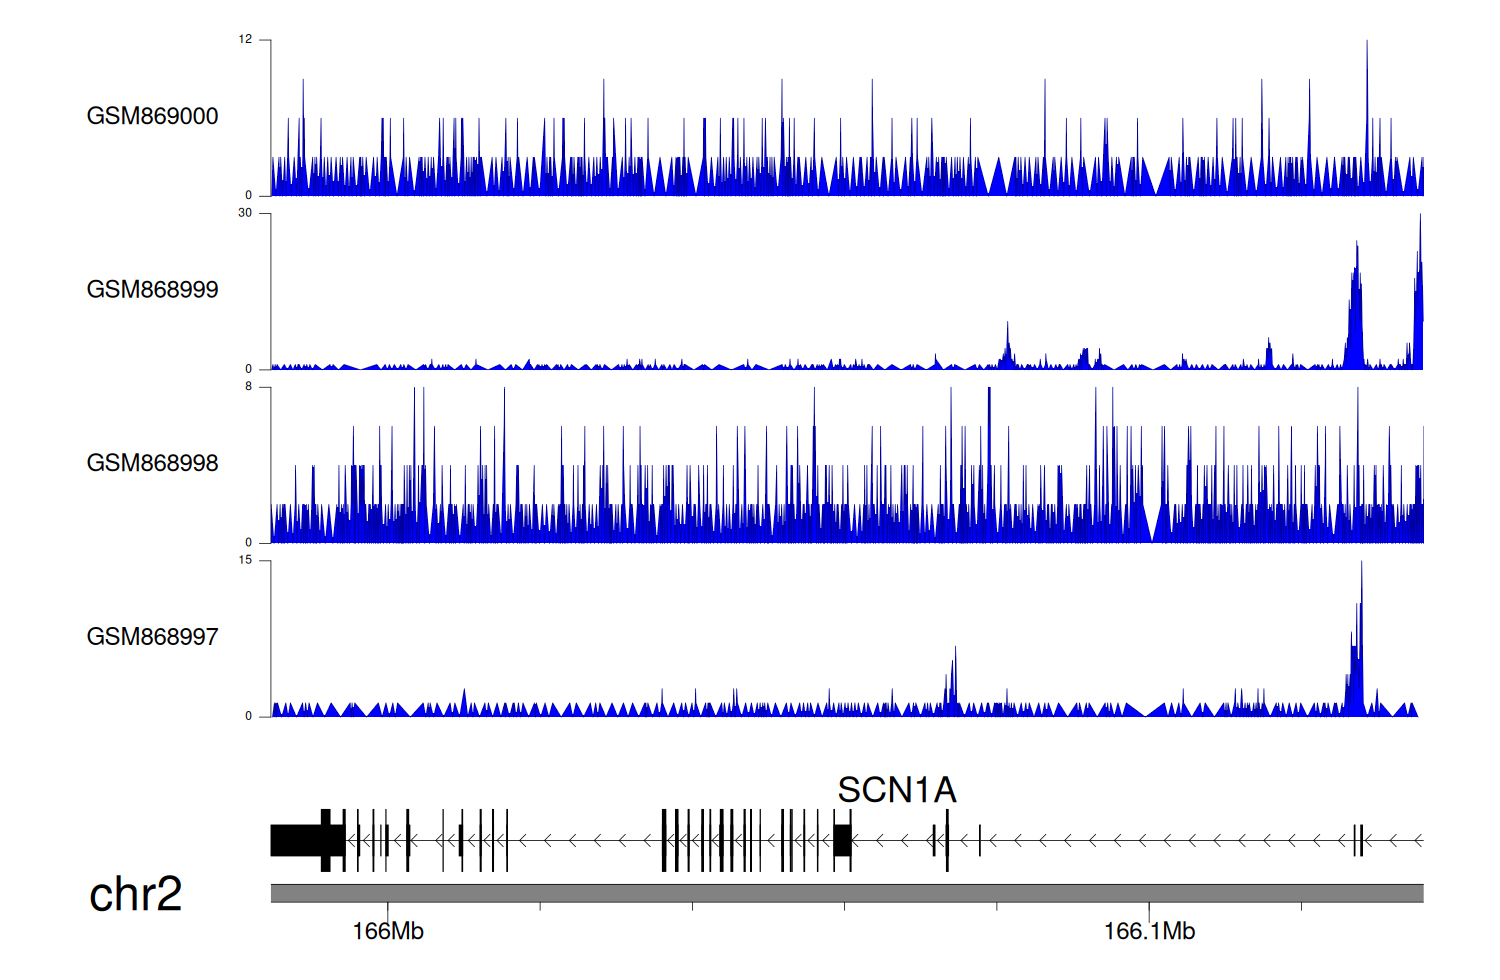
> Dataset: GSE35465 - SCN1A peak across samples
|
Peak Plot
|
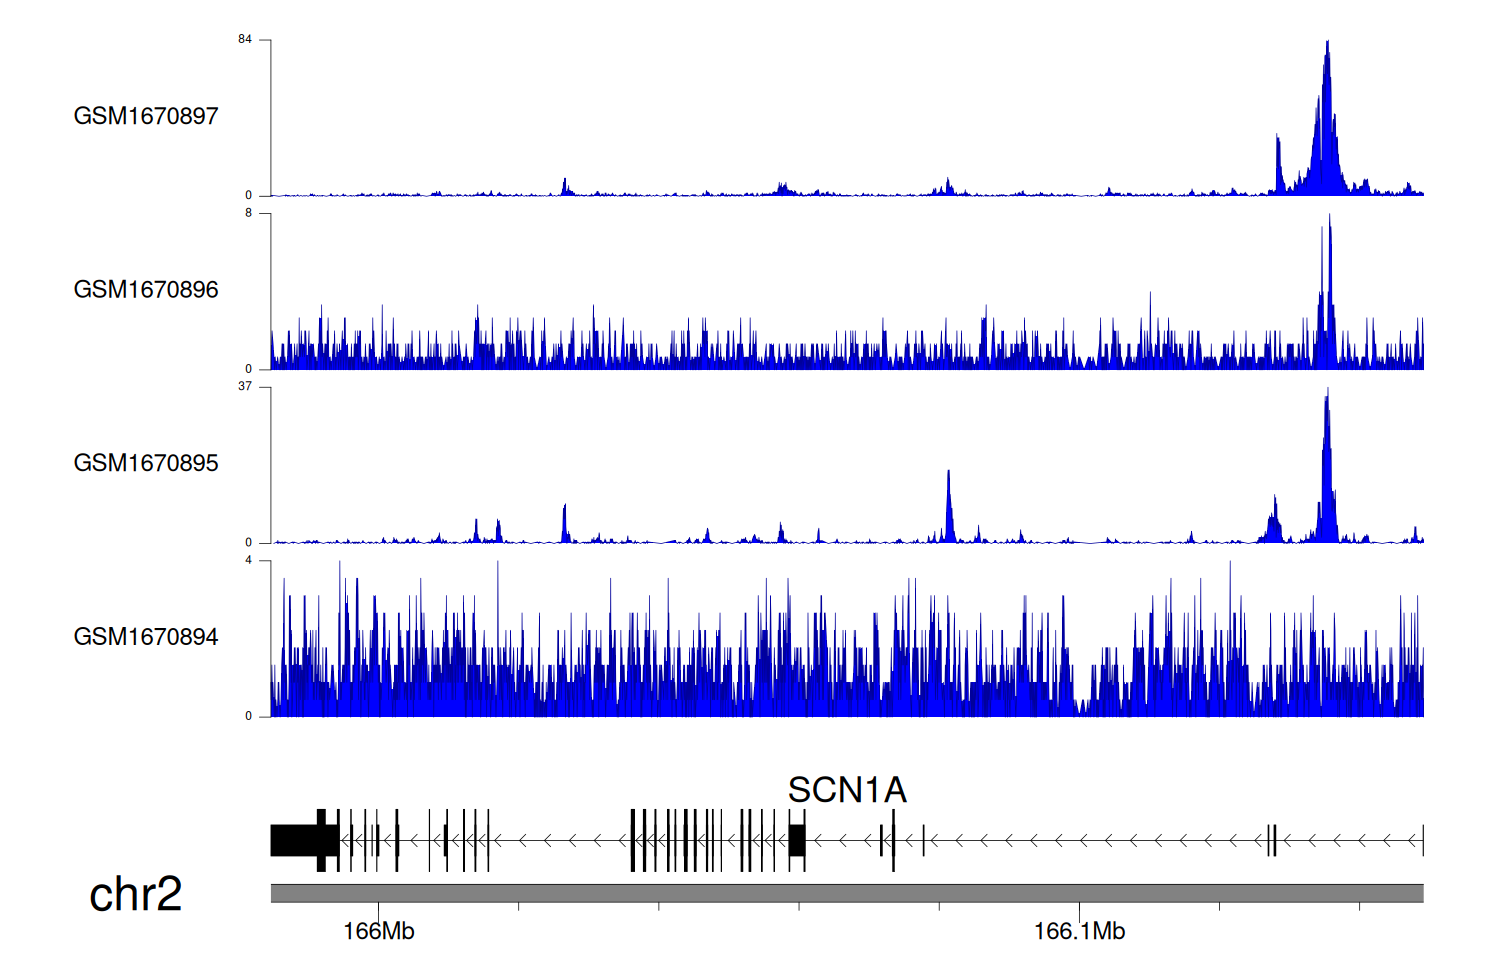
> Dataset: GSE68402 - SCN1A peak across samples
|
Peak Plot
|
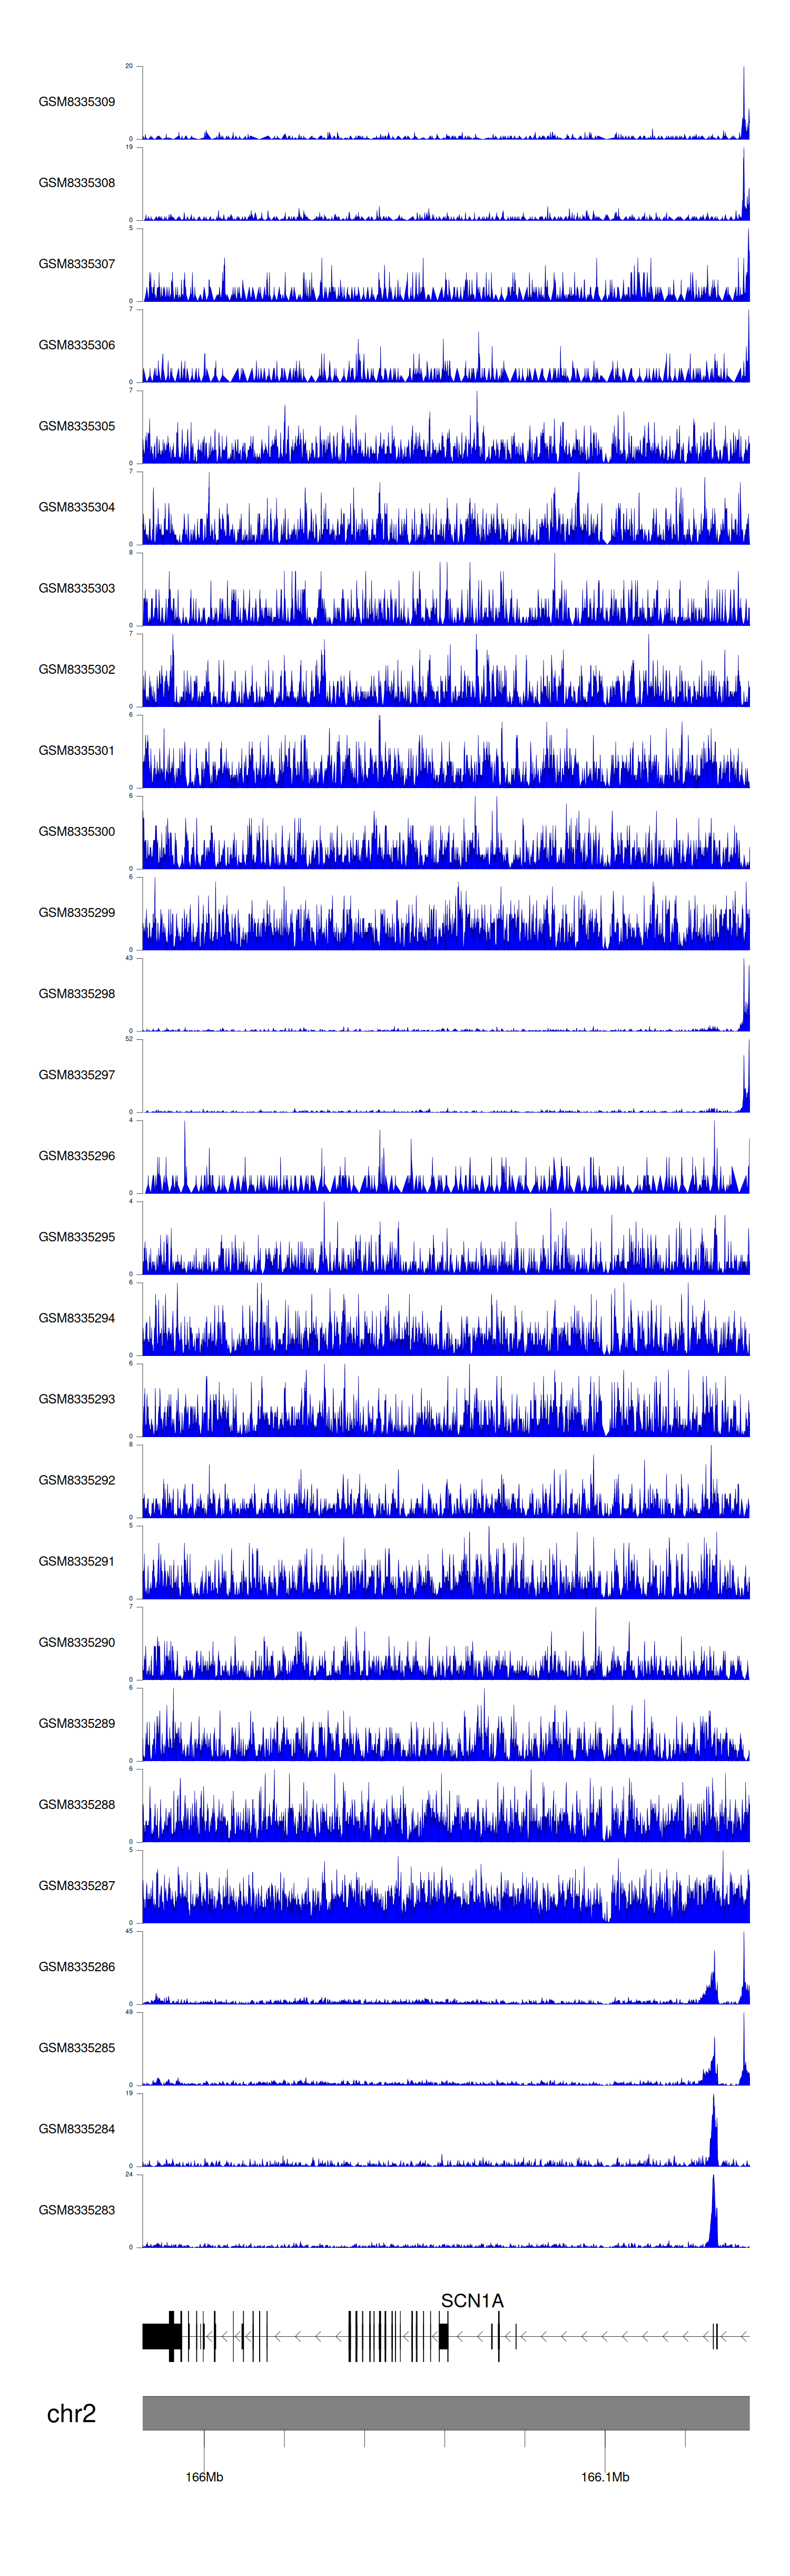
> Dataset: GSE270130 - SCN1A peak across samples
|
Peak Plot
|
> Dataset: GSE100400 - SCN1A peak across samples
|
Peak Plot
|
> Dataset: GSE131257 - SCN1A peak across samples
|
Peak Plot
|
|
|
