Gene Information
|
Gene Name
|
SEMA3A |
|
Gene ID
|
10371
|
|
Gene Full Name
|
semaphorin 3A |
|
Gene Alias
|
COLL1|HH16|Hsema-I|Hsema-III|SEMA1|SEMAD|SEMAIII|SEMAL|SemD|coll-1 |
|
Transcripts
|
ENSG00000075213
|
|
Virus
|
HBV |
|
Gene Type
|
protein-coding |
|
HPA Location Info
|
Vesicles;Secreted in other tissues; 
|
|
Membrane Info
|
Disease related genes, Human disease related genes, Plasma proteins, Predicted secreted proteins |
|
Uniport_ID
|
Q14563
|
|
HGNC ID
|
HGNC:10723
|
|
OMIM ID
|
603961 |
|
Summary
|
This gene is a member of the semaphorin family and encodes a protein with an Ig-like C2-type (immunoglobulin-like) domain, a PSI domain and a Sema domain. This secreted protein can function as either a chemorepulsive agent, inhibiting axonal outgrowth, or as a chemoattractive agent, stimulating the growth of apical dendrites. In both cases, the protein is vital for normal neuronal pattern development. Increased expression of this protein is associated with schizophrenia and is seen in a variety of human tumor cell lines. Also, aberrant release of this protein is associated with the progression of Alzheimer's disease. [provided by RefSeq, Jul 2008] |
Target gene [SEMA3A] related to VISs 
Integration Table: if previous studies reported that target gene was altered by virus integration events, the overlap between VISs in this literature and Cistrome factors was listed in this section
| DVID |
Chromosome |
HM |
TFBS |
CA |
Sum of Overlapped Records |
Detail |
| 1005592 |
chr7 |
34 |
15 |
2 |
51 |
View |
| 1010945 |
chr7 |
9 |
1 |
0 |
10 |
View |
| 1019677 |
chr7 |
0 |
0 |
0 |
0 |
View |
| 1024209 |
chr7 |
1 |
0 |
0 |
1 |
View |
Target gene [SEMA3A] related to Omics data
| Data ID |
Experiment type |
Sample number |
Platform |
|
GSE236281
|
RNA-seq |
12 |
Illumina MiSeq (Homo sapiens) |
|
C GSE35465
|
Chip-seq;RNA-seq |
6 |
Illumina HiSeq 2000 (Homo sapiens) |
|
C GSE68402
|
Chip-seq |
26 |
Illumina MiSeq (Homo sapiens);Illumina HiSeq 2500 (Homo sapiens) |
|
TCGA_LIHC_HBV
|
DNA methylation sequencing;RNA-seq |
97 |
TCGA |
|
C GSE270130
|
Chip-seq |
27 |
Illumina NovaSeq 6000 (Homo sapiens) |
|
GSE224901
|
RNA-seq |
21 |
Illumina NovaSeq 6000 (Homo sapiens) |
|
C GSE100400
|
Chip-seq;RNA-seq;4C_cccDNA |
31 |
Illumina NextSeq 500 (Homo sapiens);Illumina NextSeq 500 (Mus musculus) |
|
GSE173897
|
RNA-seq |
95 |
Illumina HiSeq 4000 (Homo sapiens) |
|
GSE262515
|
RNA-seq |
21 |
Illumina HiSeq 2500 (Homo sapiens);Illumina HiSeq 2500 (Mus musculus) |
|
GSE110345
|
RNA-seq |
4 |
Illumina HiSeq 2500 (Homo sapiens) |
|
C GSE131257
|
ATAC-seq;RNA-seq |
19 |
Illumina HiSeq 2500 (Homo sapiens) |
|
GSE94660
|
RNA-seq |
42 |
Illumina HiSeq 2500 (Homo sapiens) |
When the gene can detect a peak in the dataset, a peak plot will be displayed.
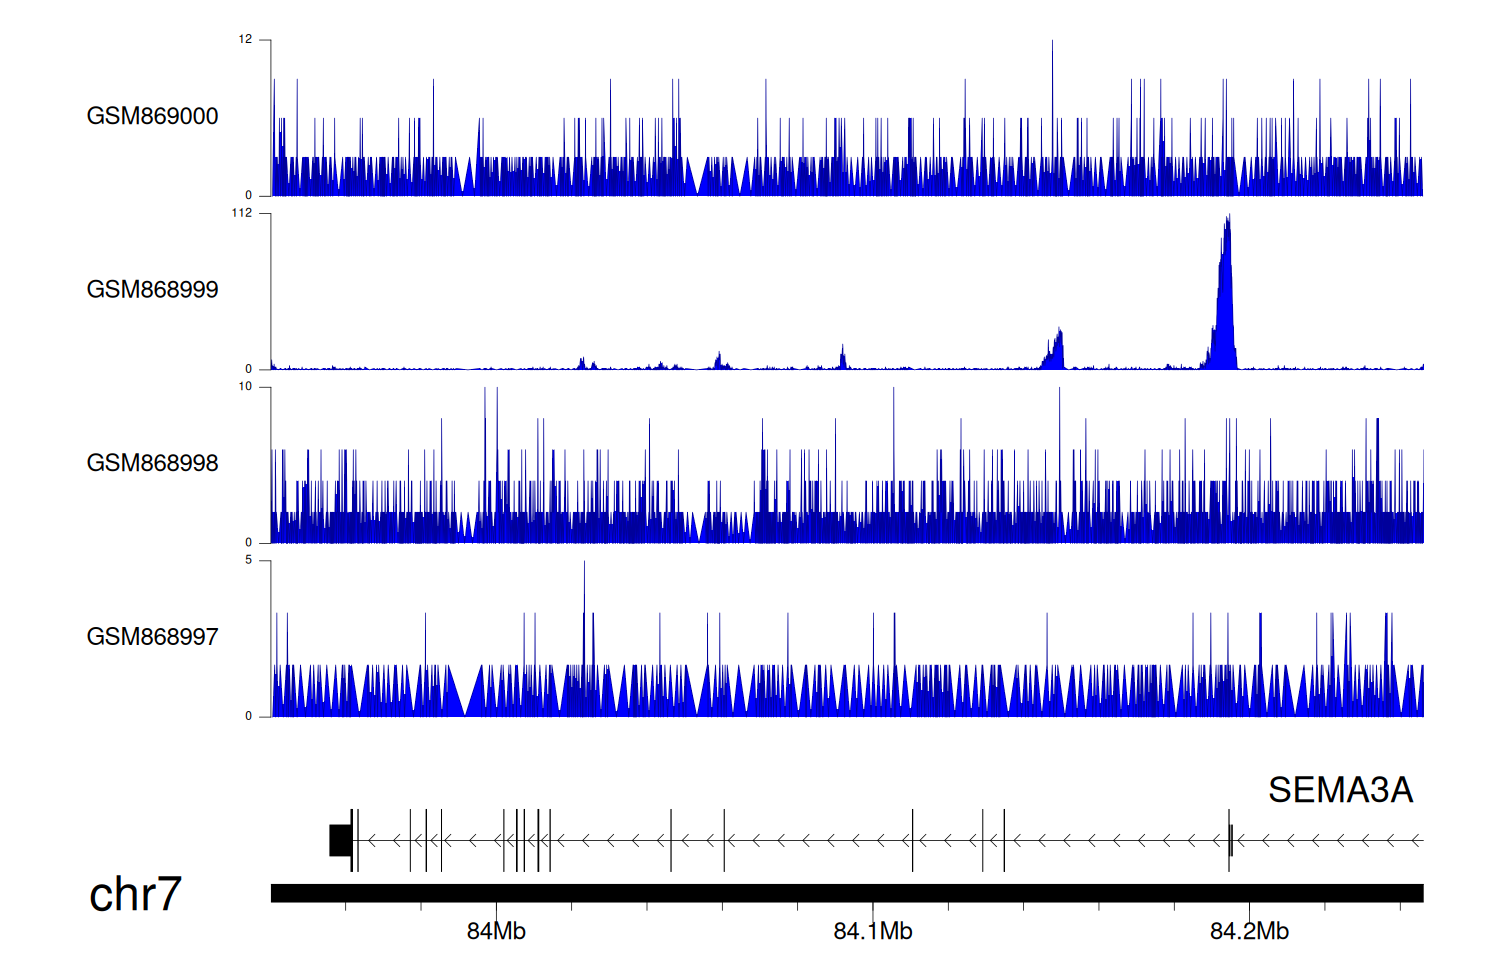
> Dataset: GSE35465 - SEMA3A peak across samples
|
Peak Plot
|
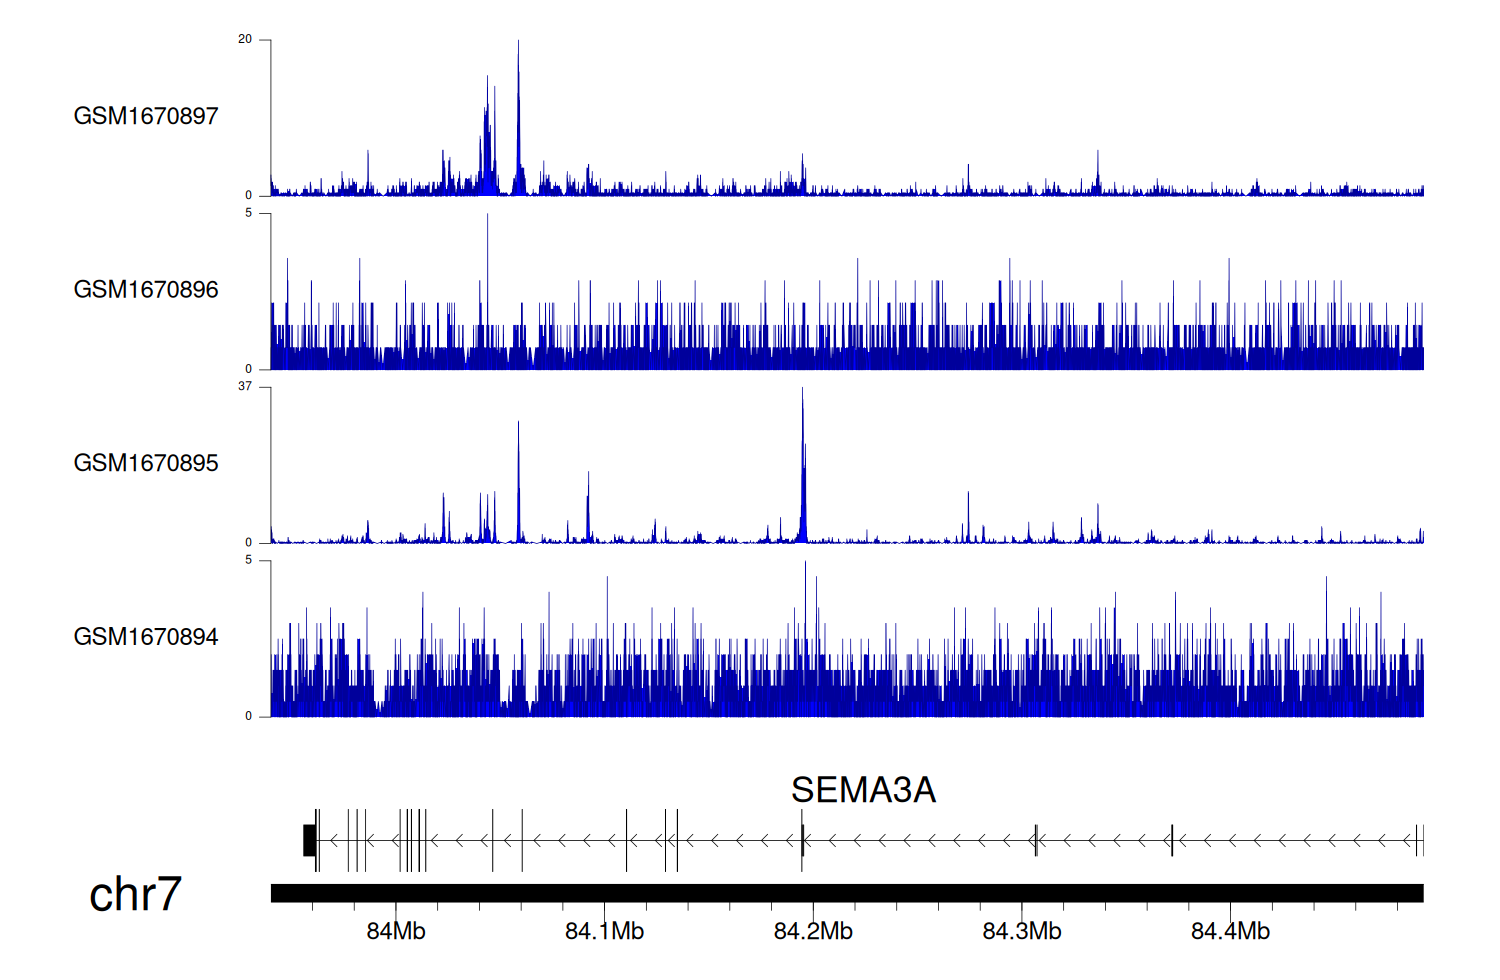
> Dataset: GSE68402 - SEMA3A peak across samples
|
Peak Plot
|
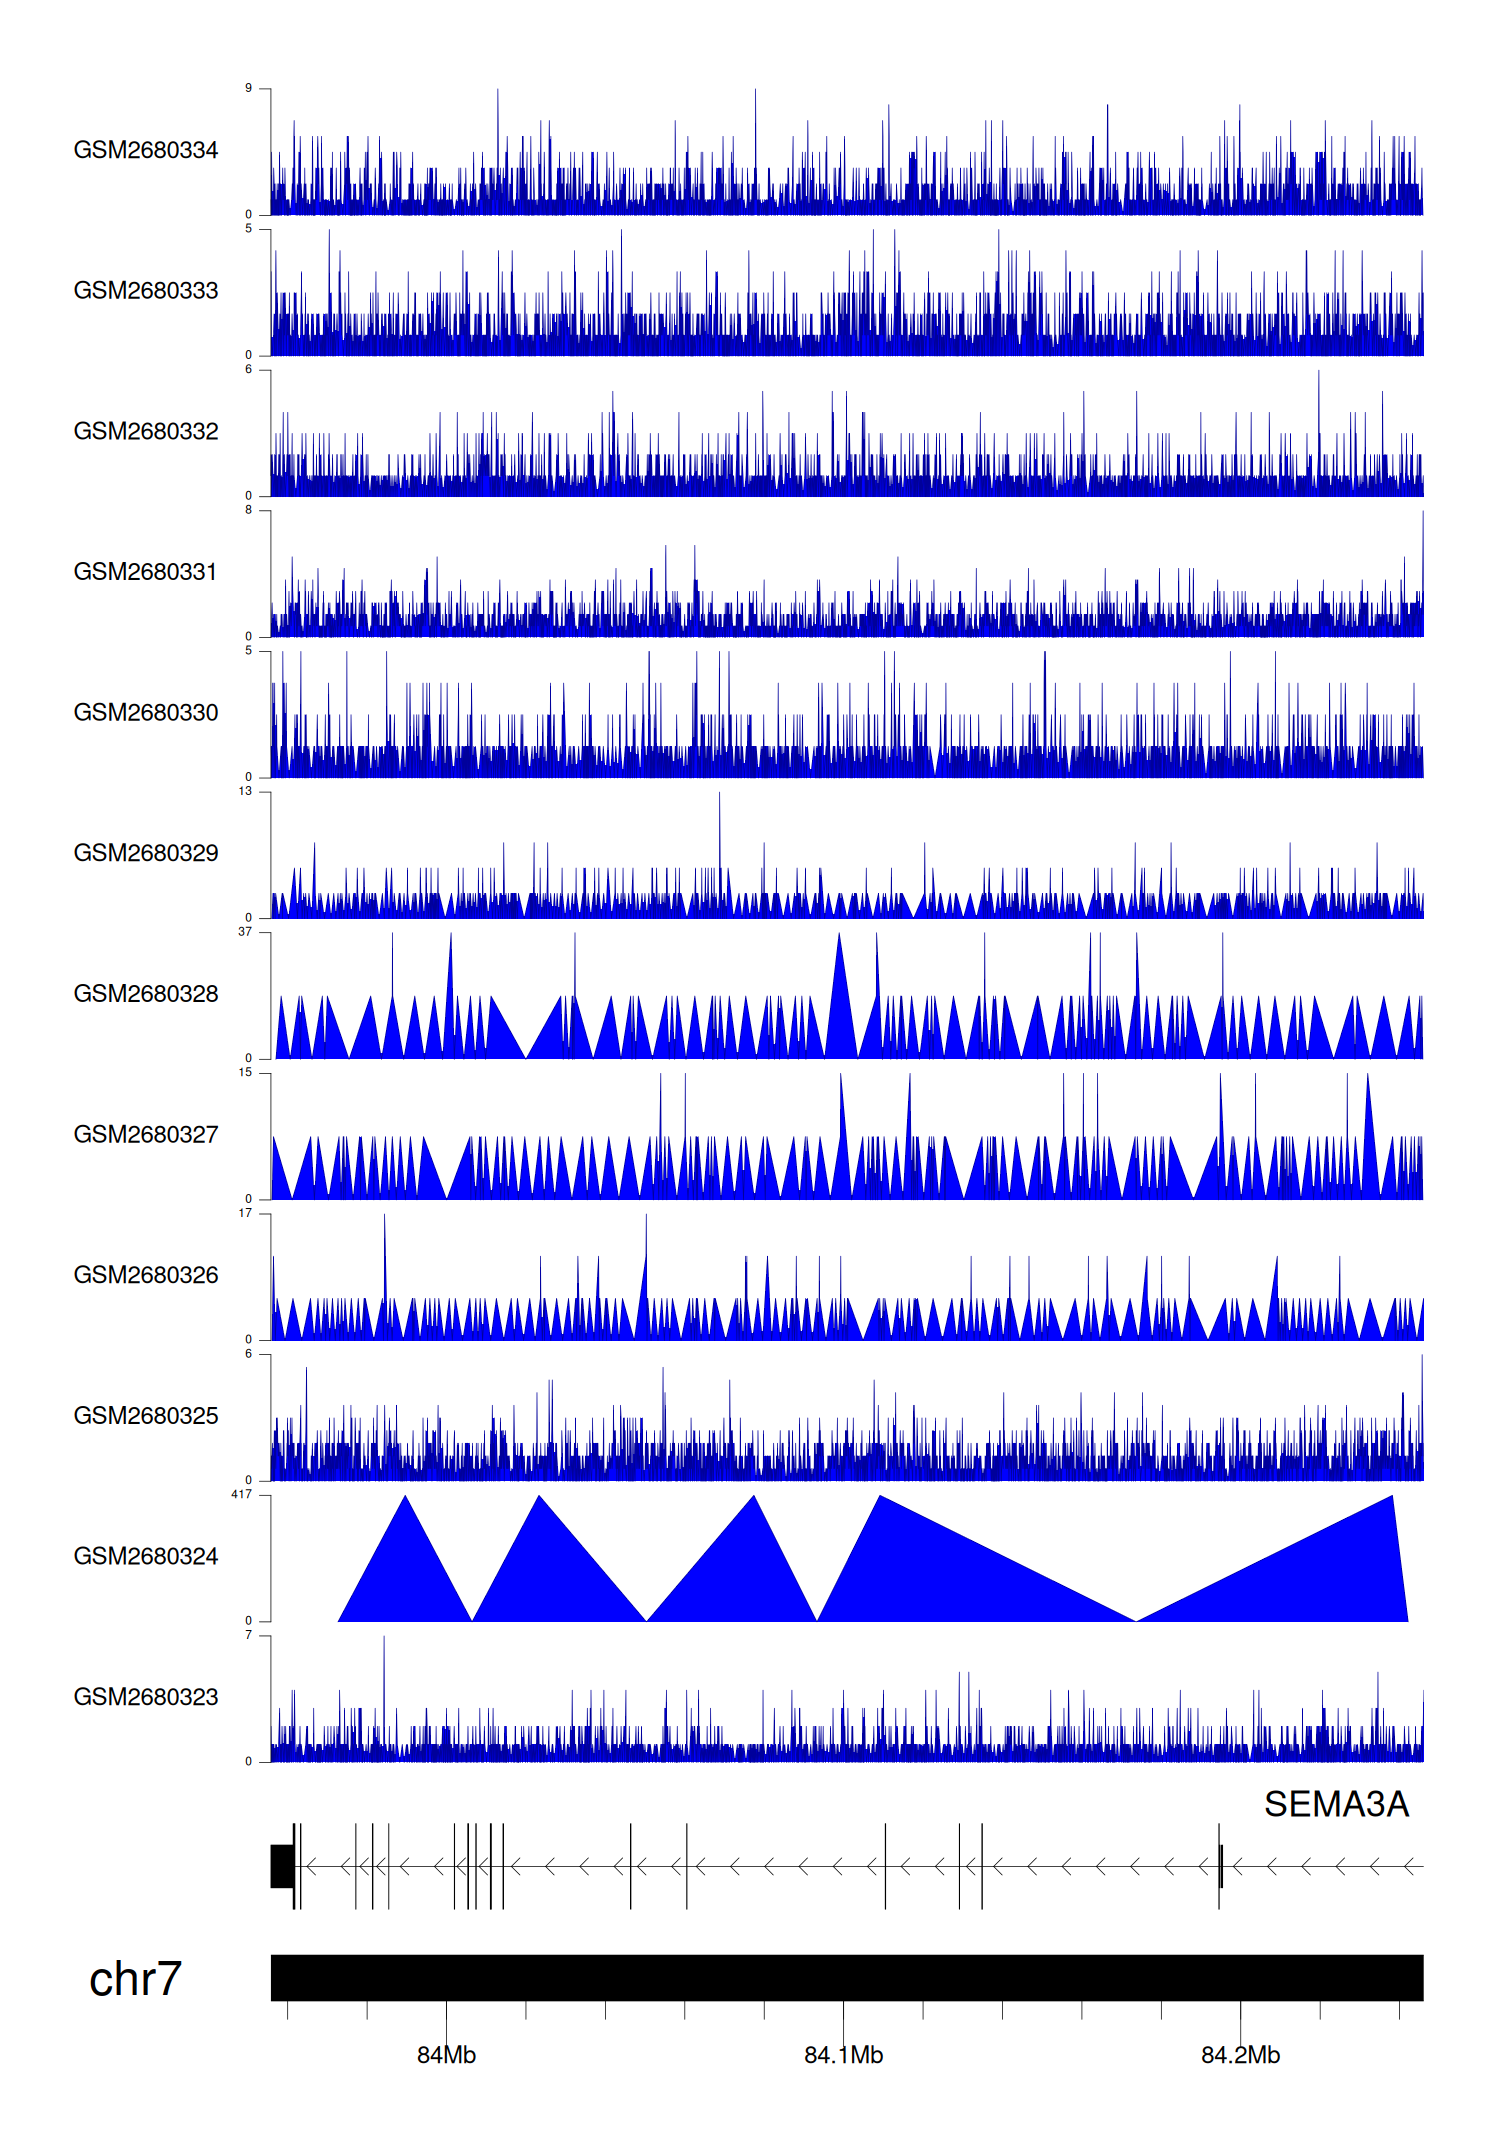
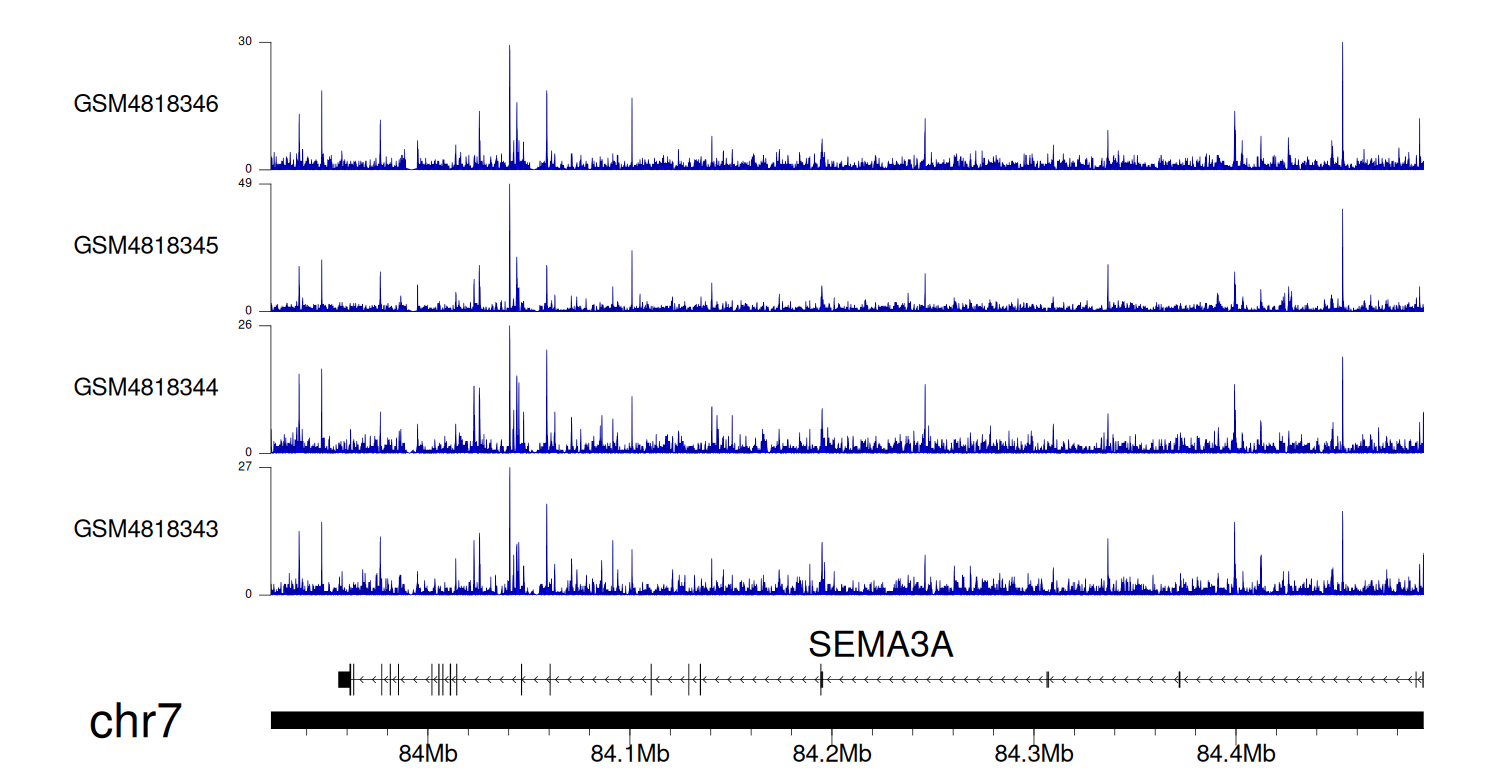
> Dataset: GSE270130 - SEMA3A peak across samples
|
Peak Plot
|
> Dataset: GSE100400 - SEMA3A peak across samples
|
Peak Plot
|
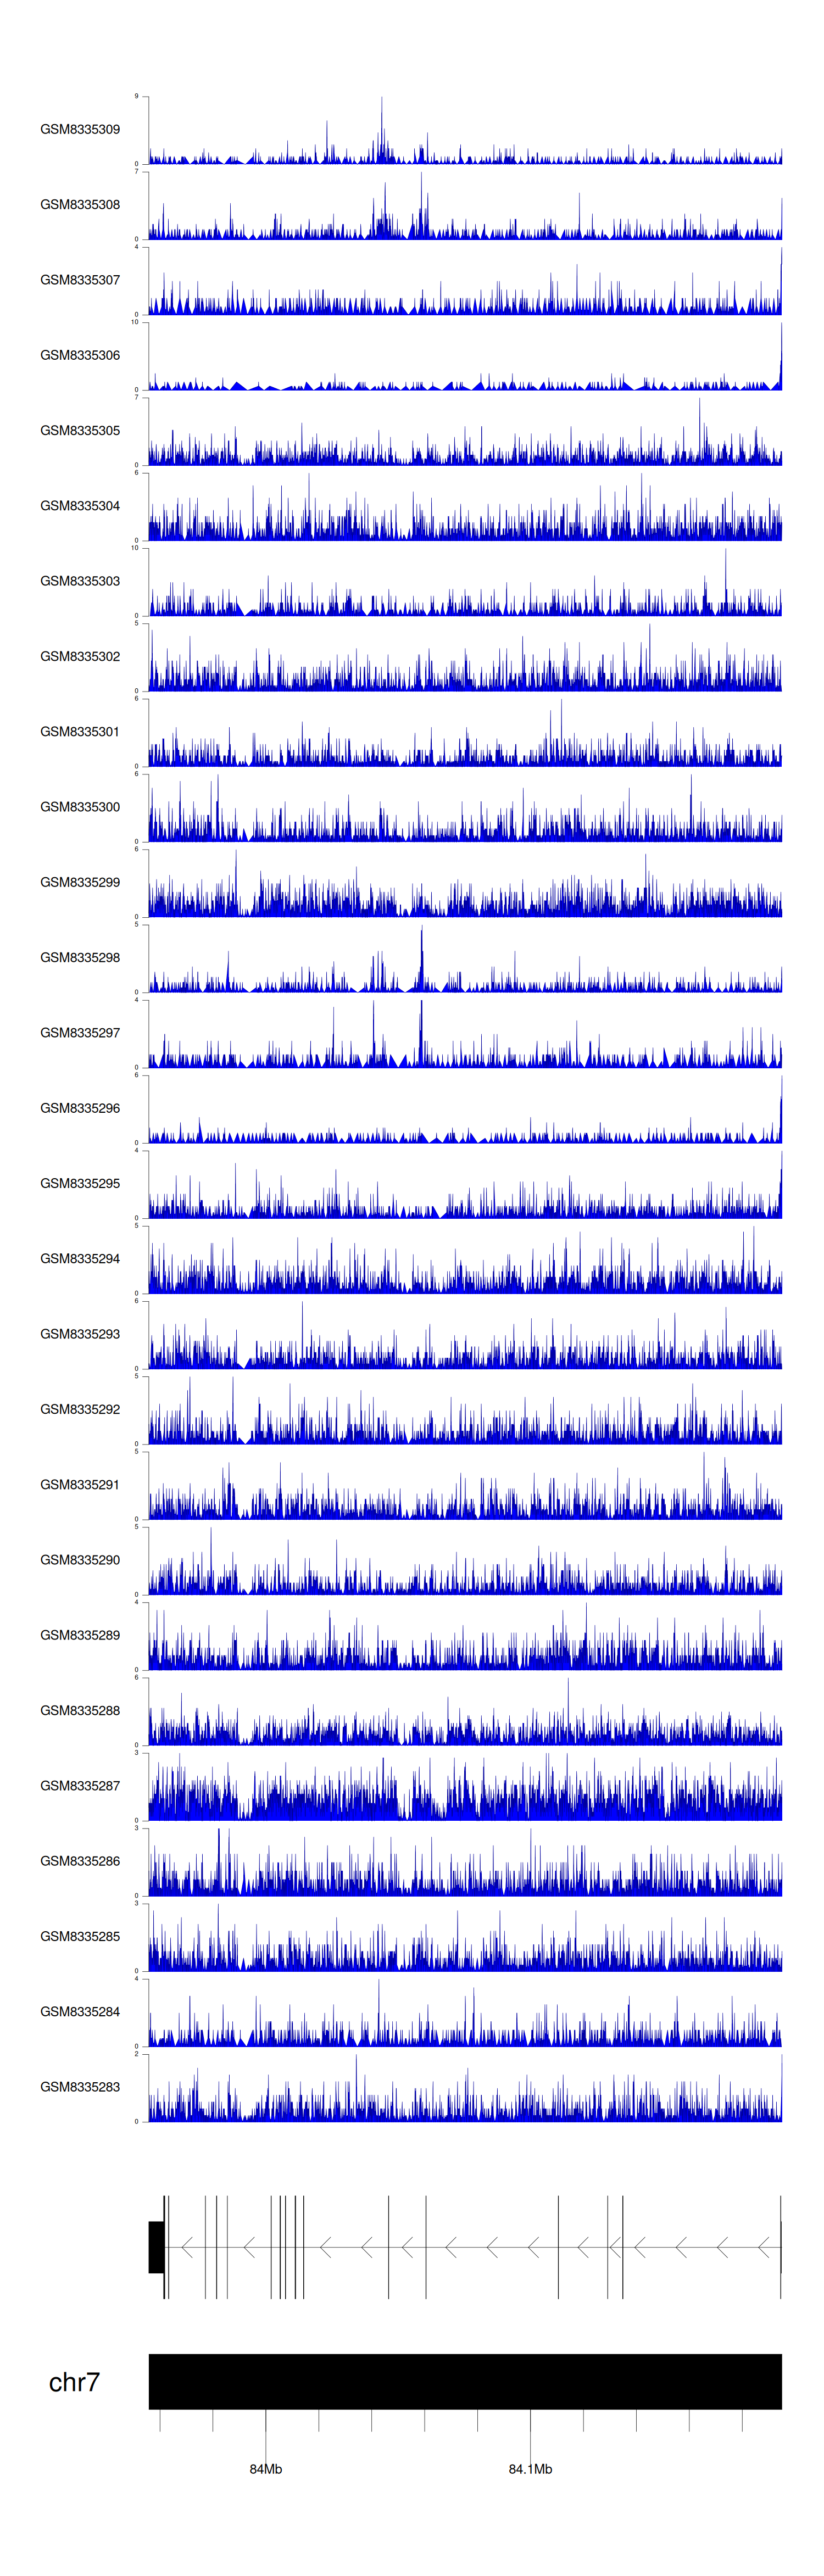
> Dataset: GSE131257 - SEMA3A peak across samples
|
Peak Plot
|
|
|
