Gene Information
|
Gene Name
|
SLC6A17 |
|
Gene ID
|
388662
|
|
Gene Full Name
|
solute carrier family 6 member 17 |
|
Gene Alias
|
MRT48|NTT4 |
|
Transcripts
|
ENSG00000197106
|
|
Virus
|
HTLV1 |
|
Gene Type
|
protein-coding |
|
HPA Location Info
|
Mitochondria; 
|
|
Membrane Info
|
Disease related genes, Human disease related genes, Potential drug targets, Predicted membrane proteins, Transporters |
|
Uniport_ID
|
Q9H1V8
|
|
HGNC ID
|
HGNC:31399
|
|
OMIM ID
|
610299 |
|
Summary
|
The protein encoded by this gene is a member of the SLC6 family of transporters, which are responsible for the presynaptic uptake of most neurotransmitters. The encoded vesicular transporter is selective for proline, glycine, leucine and alanine. In mouse, the strongest expression of this gene was in cortical and hippocampal tissues where expression increased during embryonic brain development and peaked postnatally. Defects in this gene cause a form of autosomal recessive intellectual disability. [provided by RefSeq, Jul 2017] |
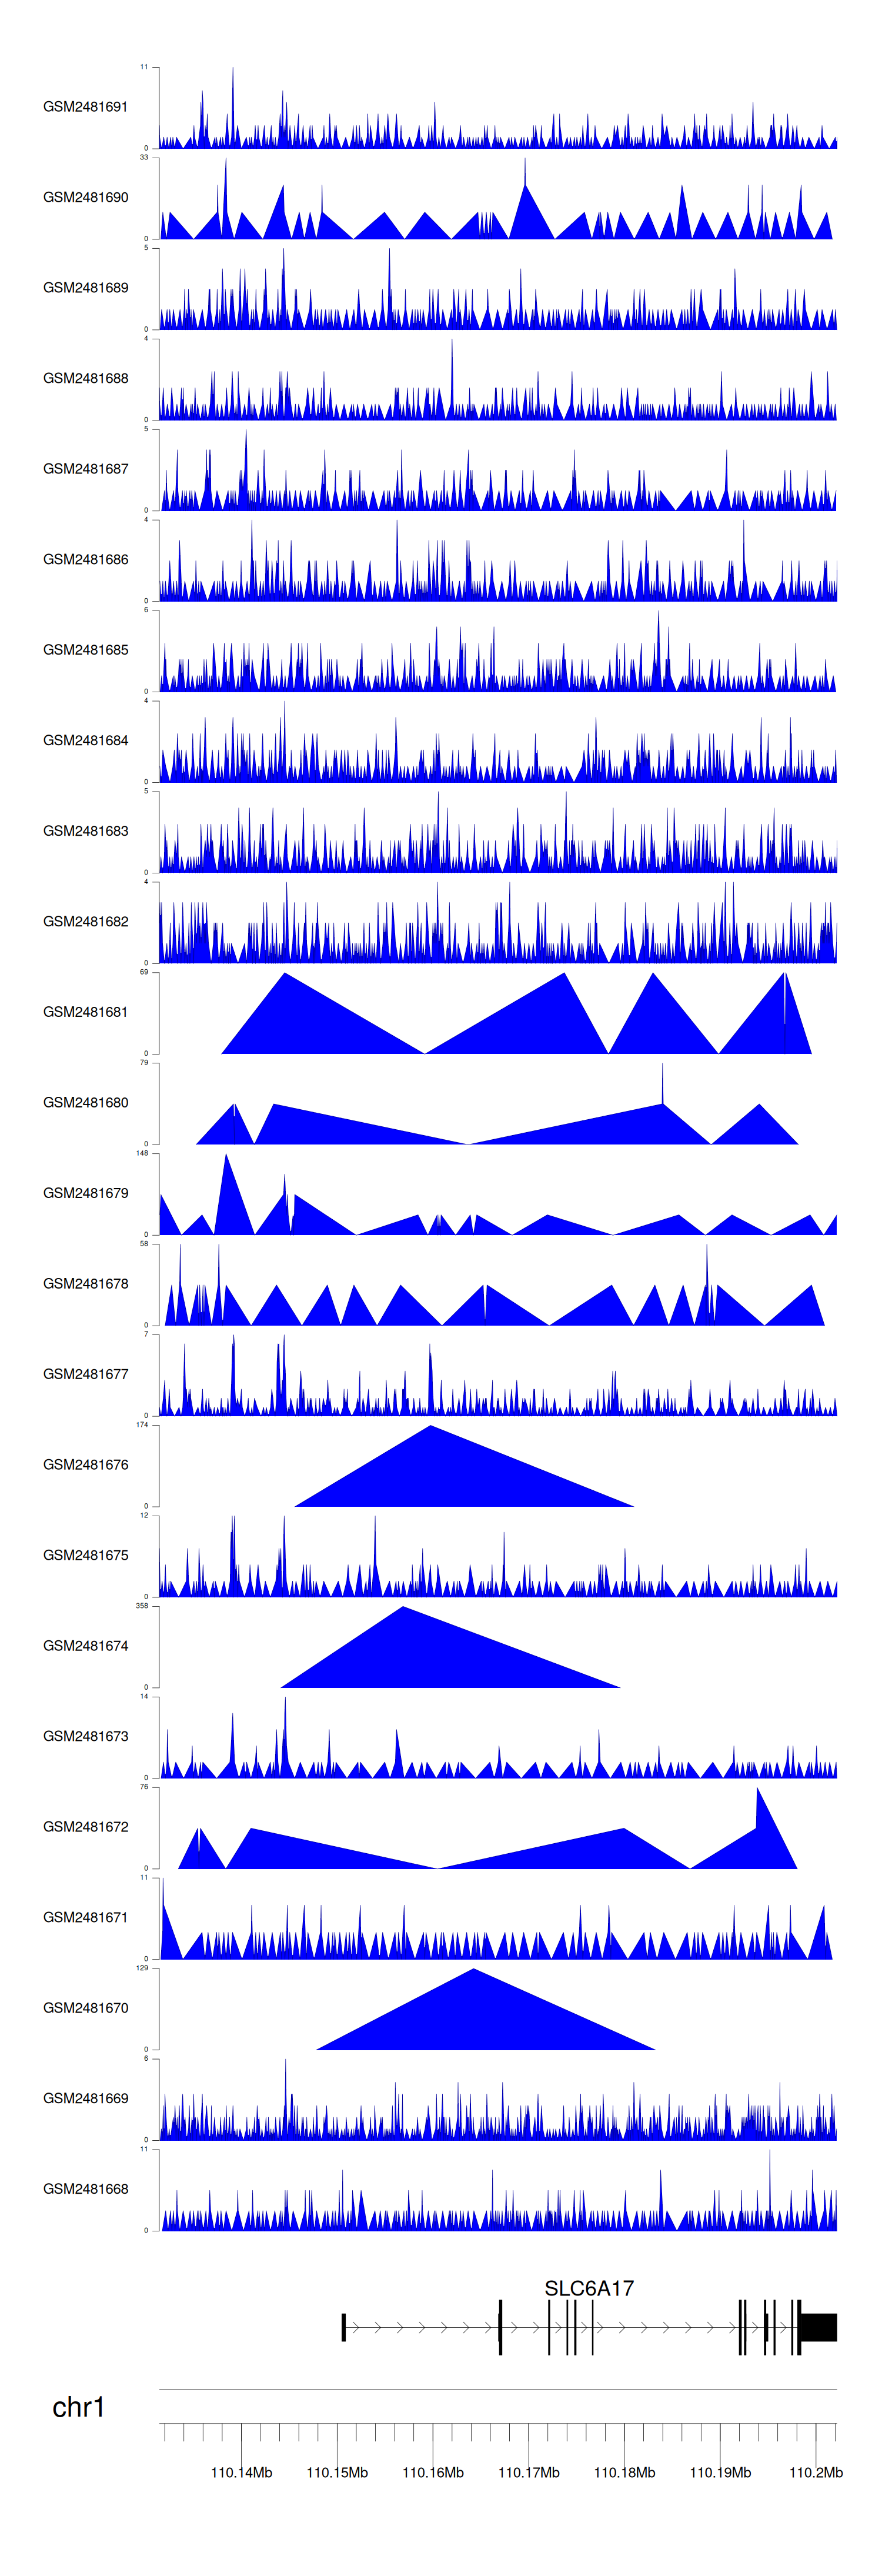
Target gene [SLC6A17] related to VISs 
Integration Table: if previous studies reported that target gene was altered by virus integration events, the overlap between VISs in this literature and Cistrome factors was listed in this section
| DVID |
Chromosome |
HM |
TFBS |
CA |
Sum of Overlapped Records |
Detail |
| 6029487 |
chr1 |
0 |
1 |
0 |
1 |
View |
Target gene [SLC6A17] related to Omics data
| Data ID |
Experiment type |
Sample number |
Platform |
|
C GSE94732
|
Chip-seq |
24 |
Illumina NextSeq 500 (Homo sapiens);illumina Genome Analyzer IIx (Homo sapiens) |
|
GSE168557
|
Expression array |
6 |
Agilent-039494 SurePrint G3 Human GE v2 8x60K Microarray 039381 (Feature Number version) |
|
GSE10789
|
Expression array |
6 |
NCI/ATC Hs-OperonV3 |
|
GSE189602
|
Methylation profiling (Array) |
4 |
Infinium MethylationEPIC |
|
GSE136189
|
Methylation profiling (Array) |
40 |
Illumina HumanMethylation450 BeadChip (HumanMethylation450_15017482);Illumina Infinium HumanMethylation850 BeadChip |
When the gene can detect a peak in the dataset, a peak plot will be displayed.
> Dataset: GSE94732 - SLC6A17 peak across samples
|
Peak Plot
|
|
|
