Gene Information
|
Gene Name
|
SNHG14 |
|
Gene ID
|
104472715
|
|
Gene Full Name
|
small nucleolar RNA host gene 14 |
|
Gene Alias
|
115HG|IC-SNURF-SNRPN|LNCAT|NCRNA00214|U-UBE3A-ATS|UBE3A-AS|UBE3A-AS1|UBE3A-ATS|UBE3AATS |
|
Virus
|
HPV |
|
Gene Type
|
ncRNA |
|
HGNC ID
|
HGNC:37462
|
|
OMIM ID
|
616259 |
|
Summary
|
This gene is located within the Prader-Willi critical region and produces a long, spliced paternally-imprinted RNA that initiates within a common upstream promoter region shared by the SNRPN (small nuclear ribonucleoprotein polypeptide N) and SNURF genes. This transcript serves as a host RNA for the small nucleolar RNA, C/D box 115 and 116 clusters. This RNA extends in antisense into the region of the ubiquitin protein ligase E3A gene (UBE3A), and is thought to regulate imprinted expression of UBE3A in the brain. This transcript undergoes extensive alternative splicing, and may initiate and terminate at multiple locations within this genomic region. The full-length structure of all splice forms is not determined. [provided by RefSeq, Mar 2017] |
Target gene [SNHG14] related to VISs 
Integration Table: if previous studies reported that target gene was altered by virus integration events, the overlap between VISs in this literature and Cistrome factors was listed in this section
| DVID |
Chromosome |
HM |
TFBS |
CA |
Sum of Overlapped Records |
Detail |
| 5006418 |
chr15 |
9 |
0 |
7 |
16 |
View |
| 5015043 |
chr15 |
37 |
17 |
6 |
60 |
View |
Target gene [SNHG14] related to Omics data
| Data ID |
Experiment type |
Sample number |
Platform |
|
E TCGA_CESC
|
DNA methylation sequencing;RNA-seq |
288 |
TCGA |
|
GSE140662
|
Expression array |
8 |
[HTA-2_0] Affymetrix Human Transcriptome Array 2.0 [transcript (gene) version] |
|
C GSE143026
|
ATAC-seq;Chip-seq;RNA-seq |
30 |
Illumina HiSeq 2500 (Homo sapiens) |
|
GSE181805
|
Expression array |
25 |
[HTA-2_0] Affymetrix Human Transcriptome Array 2.0 [transcript (gene) version] |
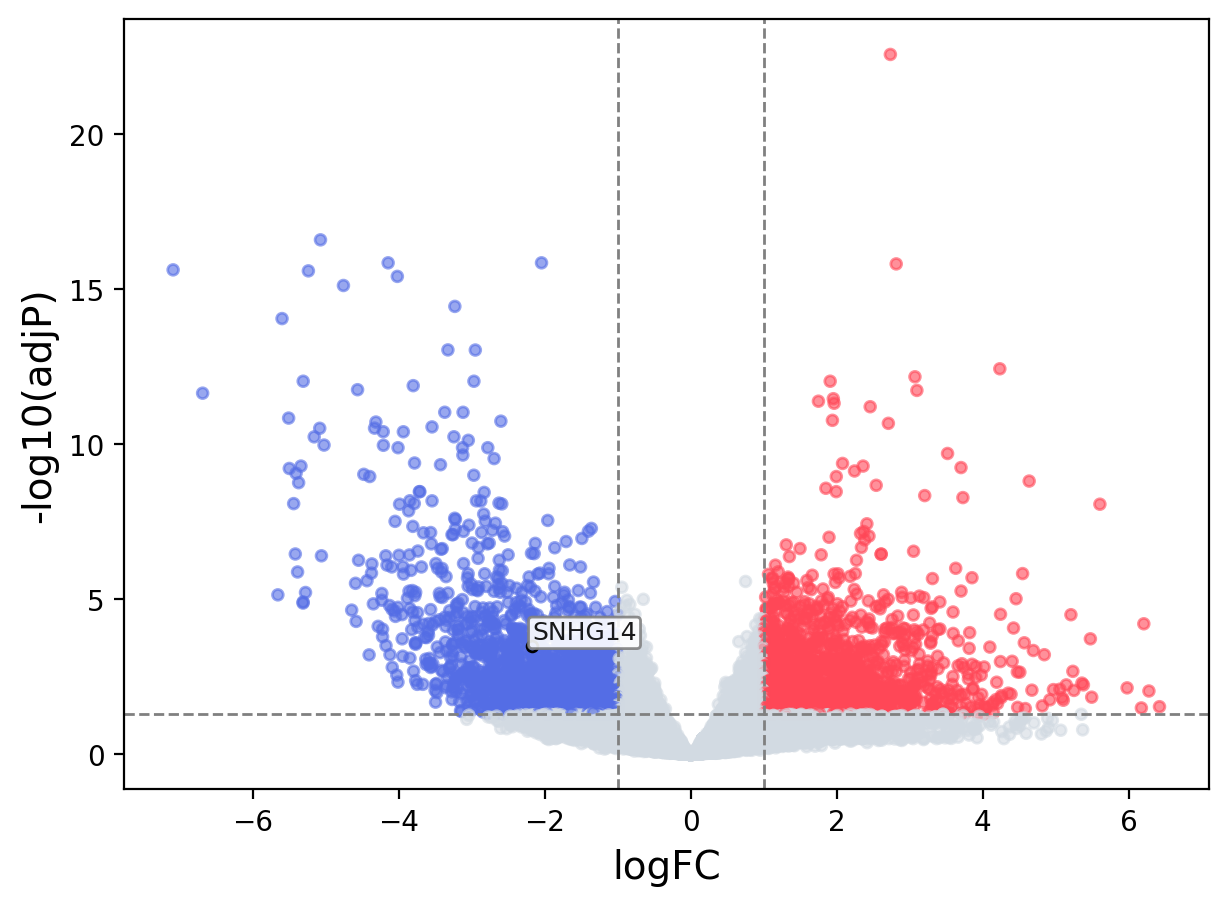
When the query gene is differentially changed in the dataset, a volcano/bar plot will be displayed.
> Dataset: TCGA_CESC - SNHG14 expression across samples
|
Volcano Plot
|
Bar Plot
|
|
|
