Gene Information
|
Gene Name
|
STARD13 |
|
Gene ID
|
90627
|
|
Gene Full Name
|
StAR related lipid transfer domain containing 13 |
|
Gene Alias
|
ARHGAP37|DLC2|GT650|LINC00464 |
|
Transcripts
|
ENSG00000133121
|
|
Virus
|
HBV |
|
Gene Type
|
protein-coding |
|
HPA Location Info
|
Golgi apparatus, Vesicles;Nucleoplasm; 
|
|
Membrane Info
|
Metabolic proteins, Plasma proteins, Predicted intracellular proteins |
|
Uniport_ID
|
Q9Y3M8
|
|
HGNC ID
|
HGNC:19164
|
|
OMIM ID
|
609866 |
|
Summary
|
This gene encodes a protein which contains an N-terminal sterile alpha motif (SAM) for protein-protein interactions, followed by an ATP/GTP-binding motif, a GTPase-activating protein (GAP) domain, and a C-terminal STAR-related lipid transfer (START) domain. It may be involved in regulation of cytoskeletal reorganization, cell proliferation, and cell motility, and acts as a tumor suppressor in hepatoma cells. The gene is located in a region of chromosome 13 that is associated with loss of heterozygosity in hepatocellular carcinomas. Alternatively spliced transcript variants encoding different isoforms have been described for this gene. [provided by RefSeq, Aug 2011] |
Target gene [STARD13] related to VISs 
Integration Table: if previous studies reported that target gene was altered by virus integration events, the overlap between VISs in this literature and Cistrome factors was listed in this section
| DVID |
Chromosome |
HM |
TFBS |
CA |
Sum of Overlapped Records |
Detail |
| 1009075 |
chr13 |
4 |
4 |
9 |
17 |
View |
| 1009710 |
chr13 |
6 |
7 |
1 |
14 |
View |
| 1012257 |
chr13 |
0 |
7 |
0 |
7 |
View |
| 1012258 |
chr13 |
0 |
7 |
0 |
7 |
View |
| 1014648 |
chr13 |
3 |
0 |
0 |
3 |
View |
| 1017173 |
chr13 |
1 |
0 |
0 |
1 |
View |
| 1023933 |
chr13 |
4 |
4 |
9 |
17 |
View |
| 1024107 |
chr13 |
3 |
4 |
1 |
8 |
View |
Target gene [STARD13] related to Omics data
| Data ID |
Experiment type |
Sample number |
Platform |
|
GSE236281
|
RNA-seq |
12 |
Illumina MiSeq (Homo sapiens) |
|
C GSE35465
|
Chip-seq;RNA-seq |
6 |
Illumina HiSeq 2000 (Homo sapiens) |
|
C GSE68402
|
Chip-seq |
26 |
Illumina MiSeq (Homo sapiens);Illumina HiSeq 2500 (Homo sapiens) |
|
TCGA_LIHC_HBV
|
DNA methylation sequencing;RNA-seq |
97 |
TCGA |
|
C GSE270130
|
Chip-seq |
27 |
Illumina NovaSeq 6000 (Homo sapiens) |
|
GSE224901
|
RNA-seq |
21 |
Illumina NovaSeq 6000 (Homo sapiens) |
|
GSE100400
|
Chip-seq;RNA-seq;4C_cccDNA |
31 |
Illumina NextSeq 500 (Homo sapiens);Illumina NextSeq 500 (Mus musculus) |
|
GSE173897
|
RNA-seq |
95 |
Illumina HiSeq 4000 (Homo sapiens) |
|
GSE262515
|
RNA-seq |
21 |
Illumina HiSeq 2500 (Homo sapiens);Illumina HiSeq 2500 (Mus musculus) |
|
GSE110345
|
RNA-seq |
4 |
Illumina HiSeq 2500 (Homo sapiens) |
|
C GSE131257
|
ATAC-seq;RNA-seq |
19 |
Illumina HiSeq 2500 (Homo sapiens) |
|
GSE94660
|
RNA-seq |
42 |
Illumina HiSeq 2500 (Homo sapiens) |
When the gene can detect a peak in the dataset, a peak plot will be displayed.
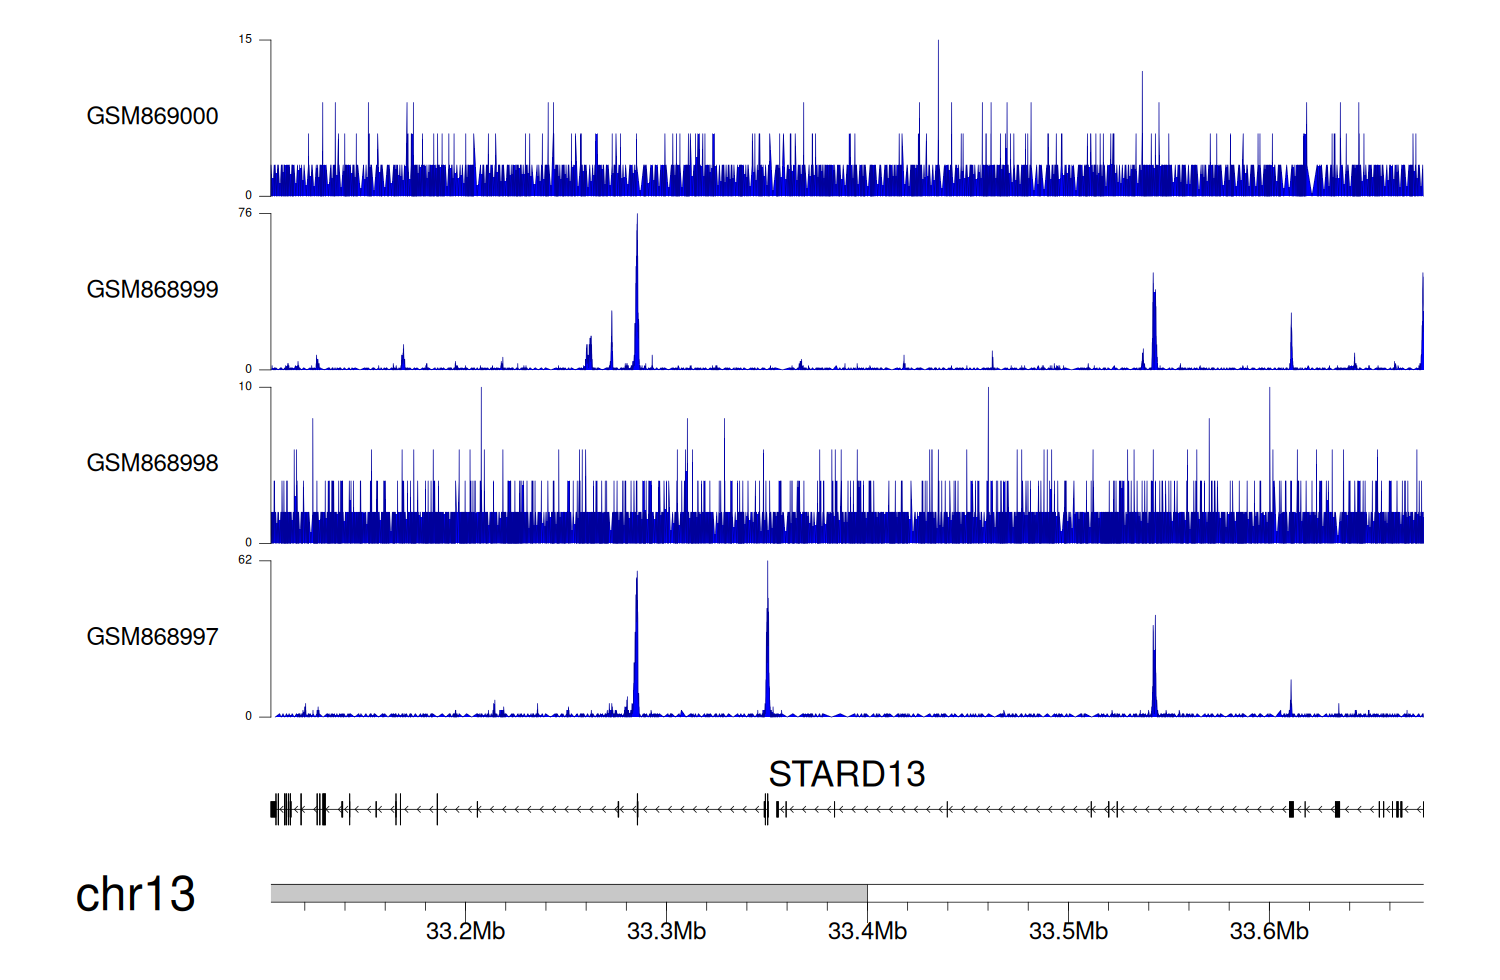
> Dataset: GSE35465 - STARD13 peak across samples
|
Peak Plot
|
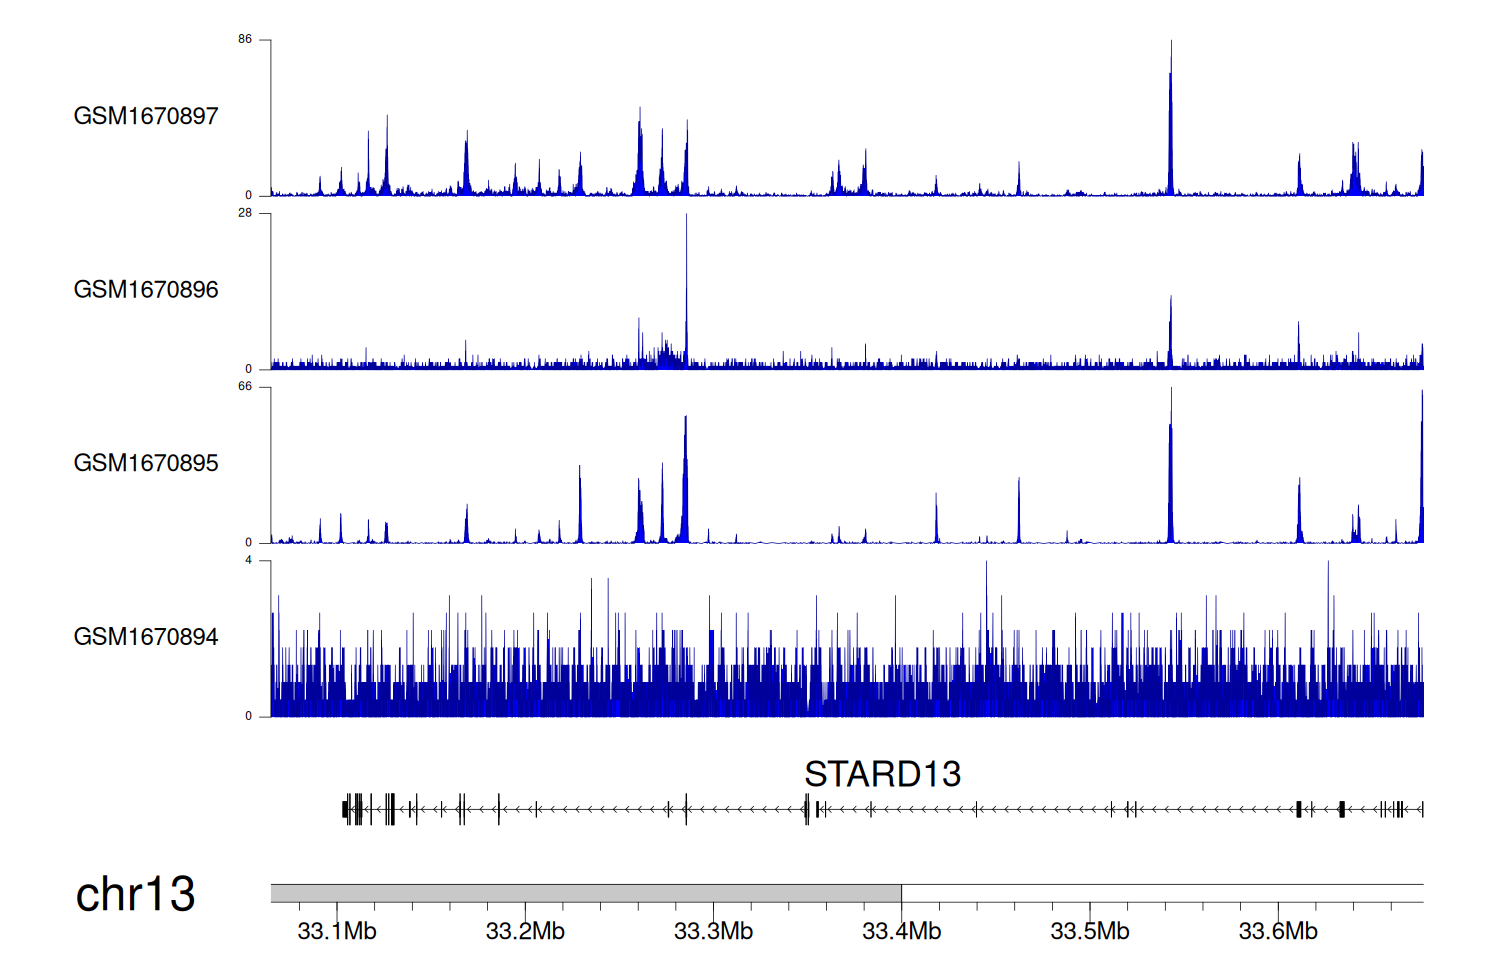
> Dataset: GSE68402 - STARD13 peak across samples
|
Peak Plot
|
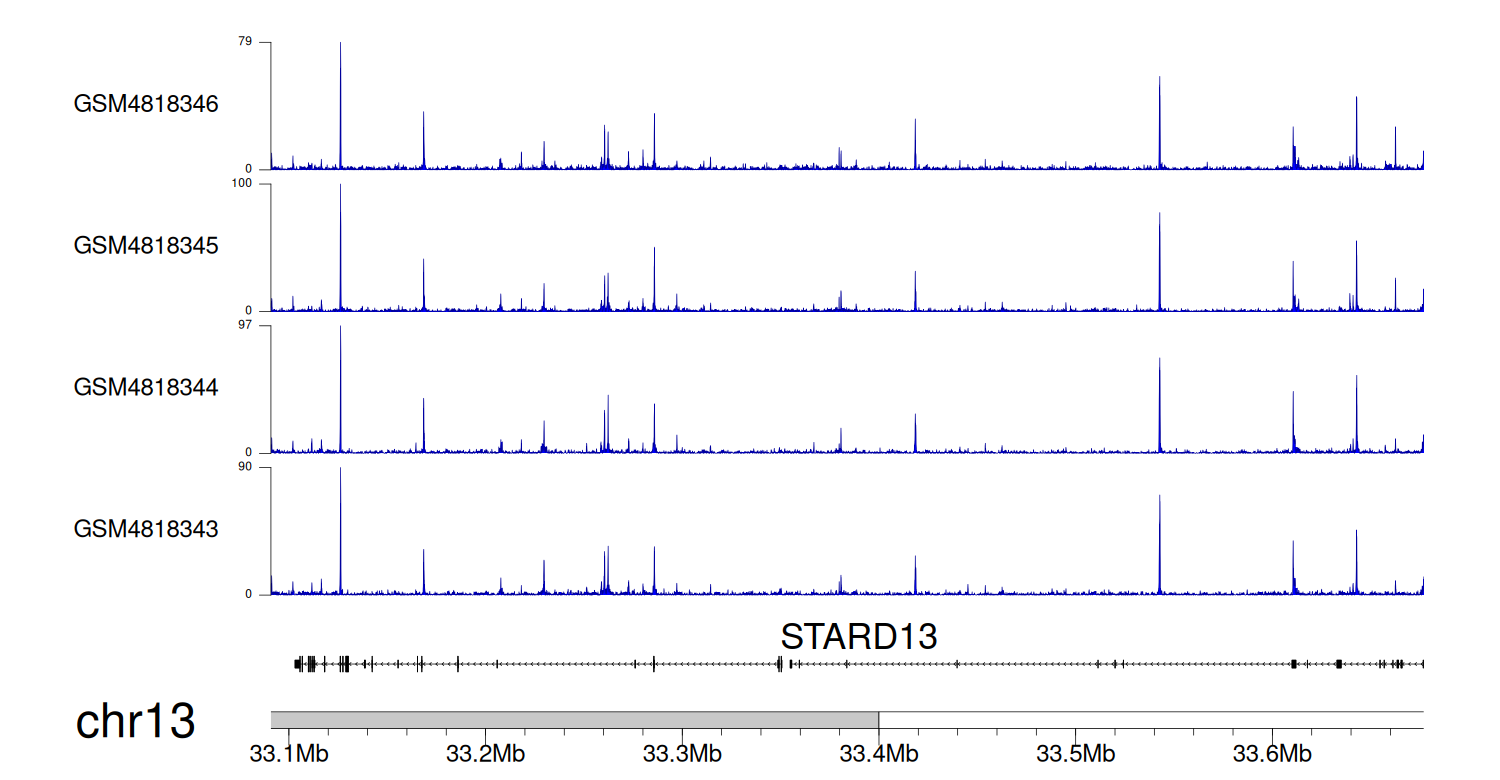
> Dataset: GSE270130 - STARD13 peak across samples
|
Peak Plot
|
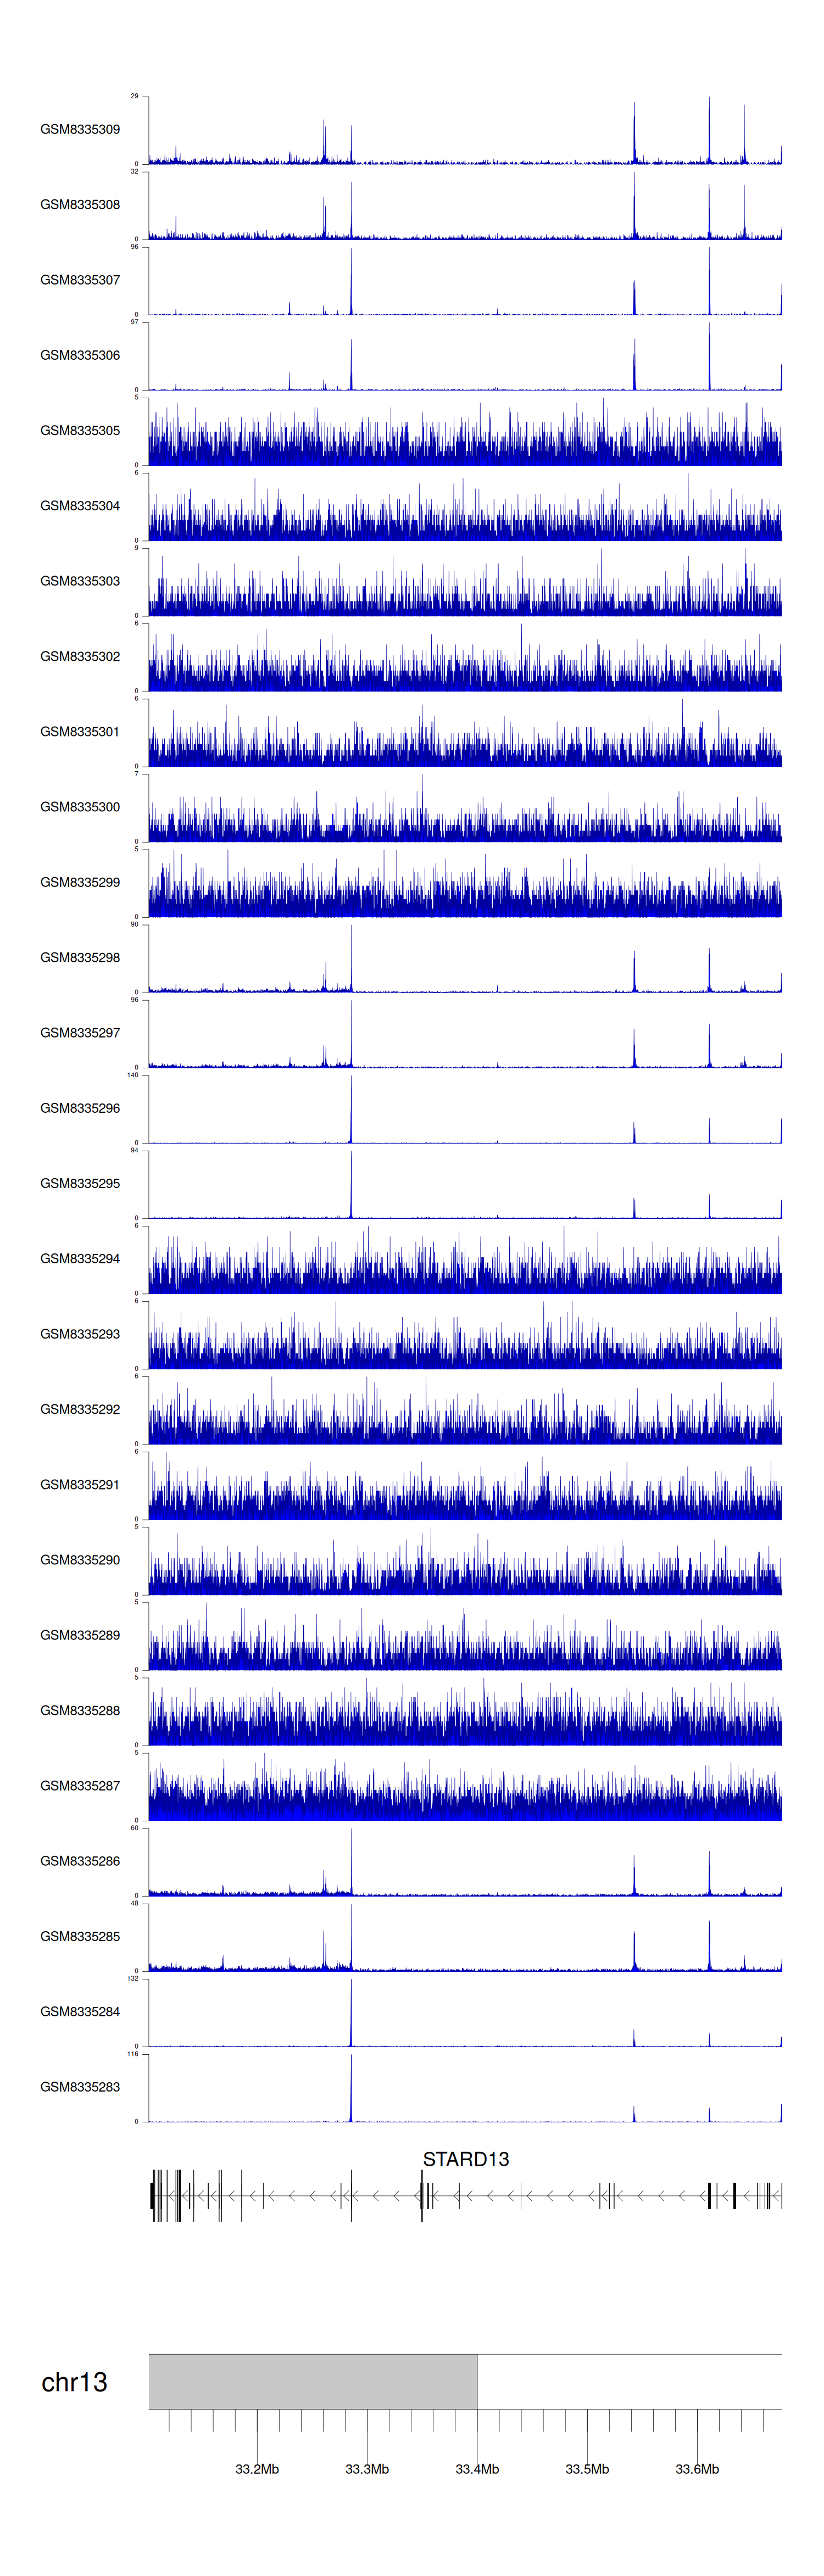
> Dataset: GSE131257 - STARD13 peak across samples
|
Peak Plot
|
|
|
