Gene Information
|
Gene Name
|
TAFA2 |
|
Gene ID
|
338811
|
|
Gene Full Name
|
TAFA chemokine like family member 2 |
|
Gene Alias
|
FAM19A2|TAFA-2 |
|
Transcripts
|
ENSG00000198673
|
|
Virus
|
HPV |
|
Gene Type
|
protein-coding |
|
HPA Location Info
|
Intracellular and membrane; 
|
|
Membrane Info
|
Predicted intracellular proteins |
|
Uniport_ID
|
Q8N3H0
|
|
HGNC ID
|
HGNC:21589
|
|
OMIM ID
|
617496 |
|
Summary
|
This gene is a member of the TAFA family which is composed of five highly homologous genes that encode small secreted proteins. These proteins contain conserved cysteine residues at fixed positions, and are distantly related to MIP-1alpha, a member of the CC-chemokine family. The TAFA proteins are predominantly expressed in specific regions of the brain, and are postulated to function as brain-specific chemokines or neurokines, that act as regulators of immune and nervous cells. [provided by RefSeq, Jul 2008] |
Target gene [TAFA2] related to VISs 
Integration Table: if previous studies reported that target gene was altered by virus integration events, the overlap between VISs in this literature and Cistrome factors was listed in this section
| DVID |
Chromosome |
HM |
TFBS |
CA |
Sum of Overlapped Records |
Detail |
| 5002924 |
chr12 |
1 |
5 |
0 |
6 |
View |
| 5006328 |
chr12 |
11 |
0 |
0 |
11 |
View |
| 5011790 |
chr12 |
23 |
2 |
0 |
25 |
View |
| 5014880 |
chr12 |
0 |
1 |
0 |
1 |
View |
| 5014881 |
chr12 |
0 |
0 |
0 |
0 |
View |
Target gene [TAFA2] related to Omics data
| Data ID |
Experiment type |
Sample number |
Platform |
|
C GSE183048
|
Chip-seq |
24 |
Illumina HiSeq 4000 (Homo sapiens) |
|
GSE181805
|
Expression array |
25 |
[HTA-2_0] Affymetrix Human Transcriptome Array 2.0 [transcript (gene) version] |
|
GSE140662
|
Expression array |
8 |
[HTA-2_0] Affymetrix Human Transcriptome Array 2.0 [transcript (gene) version] |
|
E TCGA_CESC
|
DNA methylation sequencing;RNA-seq |
288 |
TCGA |
|
C GSE143026
|
ATAC-seq;Chip-seq;RNA-seq |
30 |
Illumina HiSeq 2500 (Homo sapiens) |
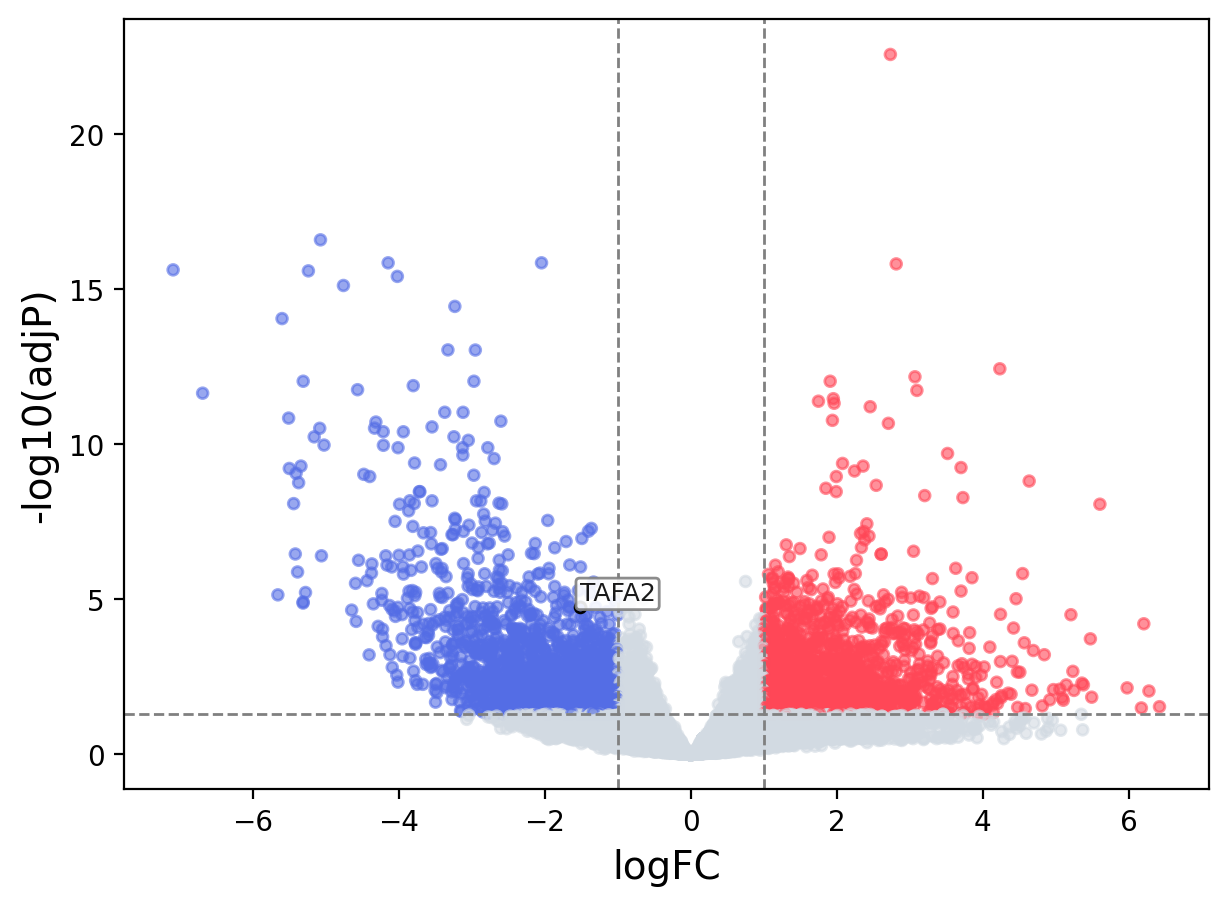
When the query gene is differentially changed in the dataset, a volcano/bar plot will be displayed.
> Dataset: TCGA_CESC - TAFA2 expression across samples
|
Volcano Plot
|
Bar Plot
|
|
|
