Gene Information
|
Gene Name
|
TTLL9 |
|
Gene ID
|
164395
|
|
Gene Full Name
|
tubulin tyrosine ligase like 9 |
|
Gene Alias
|
C20orf125 |
|
Transcripts
|
ENSG00000131044
|
|
Virus
|
HBV |
|
Gene Type
|
protein-coding |
|
HPA Location Info
|
Microtubules, Mid piece, Principal piece, End piece;Nucleoplasm, Mitotic spindle, Primary cilium, Basal body; 
|
|
Membrane Info
|
Cancer-related genes, Predicted intracellular proteins |
|
Uniport_ID
|
Q3SXZ7
|
|
HGNC ID
|
HGNC:16118
|
|
OMIM ID
|
619838 |
|
Summary
|
Predicted to enable tubulin binding activity and tubulin-glutamic acid ligase activity. Predicted to be involved in flagellated sperm motility and microtubule cytoskeleton organization. Predicted to act upstream of or within protein polyglutamylation. Predicted to be located in cytoplasm; microtubule; and motile cilium. Predicted to be active in ciliary basal body. [provided by Alliance of Genome Resources, Apr 2025] |
Target gene [TTLL9] related to VISs 
Integration Table: if previous studies reported that target gene was altered by virus integration events, the overlap between VISs in this literature and Cistrome factors was listed in this section
| DVID |
Chromosome |
HM |
TFBS |
CA |
Sum of Overlapped Records |
Detail |
| 1006320 |
chr20 |
6 |
7 |
27 |
40 |
View |
| 1006382 |
chr20 |
6 |
6 |
27 |
39 |
View |
Target gene [TTLL9] related to Omics data
| Data ID |
Experiment type |
Sample number |
Platform |
|
GSE236281
|
RNA-seq |
12 |
Illumina MiSeq (Homo sapiens) |
|
C GSE35465
|
Chip-seq;RNA-seq |
6 |
Illumina HiSeq 2000 (Homo sapiens) |
|
C GSE68402
|
Chip-seq |
26 |
Illumina MiSeq (Homo sapiens);Illumina HiSeq 2500 (Homo sapiens) |
|
TCGA_LIHC_HBV
|
DNA methylation sequencing;RNA-seq |
97 |
TCGA |
|
C GSE270130
|
Chip-seq |
27 |
Illumina NovaSeq 6000 (Homo sapiens) |
|
GSE224901
|
RNA-seq |
21 |
Illumina NovaSeq 6000 (Homo sapiens) |
|
GSE100400
|
Chip-seq;RNA-seq;4C_cccDNA |
31 |
Illumina NextSeq 500 (Homo sapiens);Illumina NextSeq 500 (Mus musculus) |
|
GSE173897
|
RNA-seq |
95 |
Illumina HiSeq 4000 (Homo sapiens) |
|
GSE262515
|
RNA-seq |
21 |
Illumina HiSeq 2500 (Homo sapiens);Illumina HiSeq 2500 (Mus musculus) |
|
GSE110345
|
RNA-seq |
4 |
Illumina HiSeq 2500 (Homo sapiens) |
|
C GSE131257
|
ATAC-seq;RNA-seq |
19 |
Illumina HiSeq 2500 (Homo sapiens) |
|
GSE94660
|
RNA-seq |
42 |
Illumina HiSeq 2500 (Homo sapiens) |
When the gene can detect a peak in the dataset, a peak plot will be displayed.
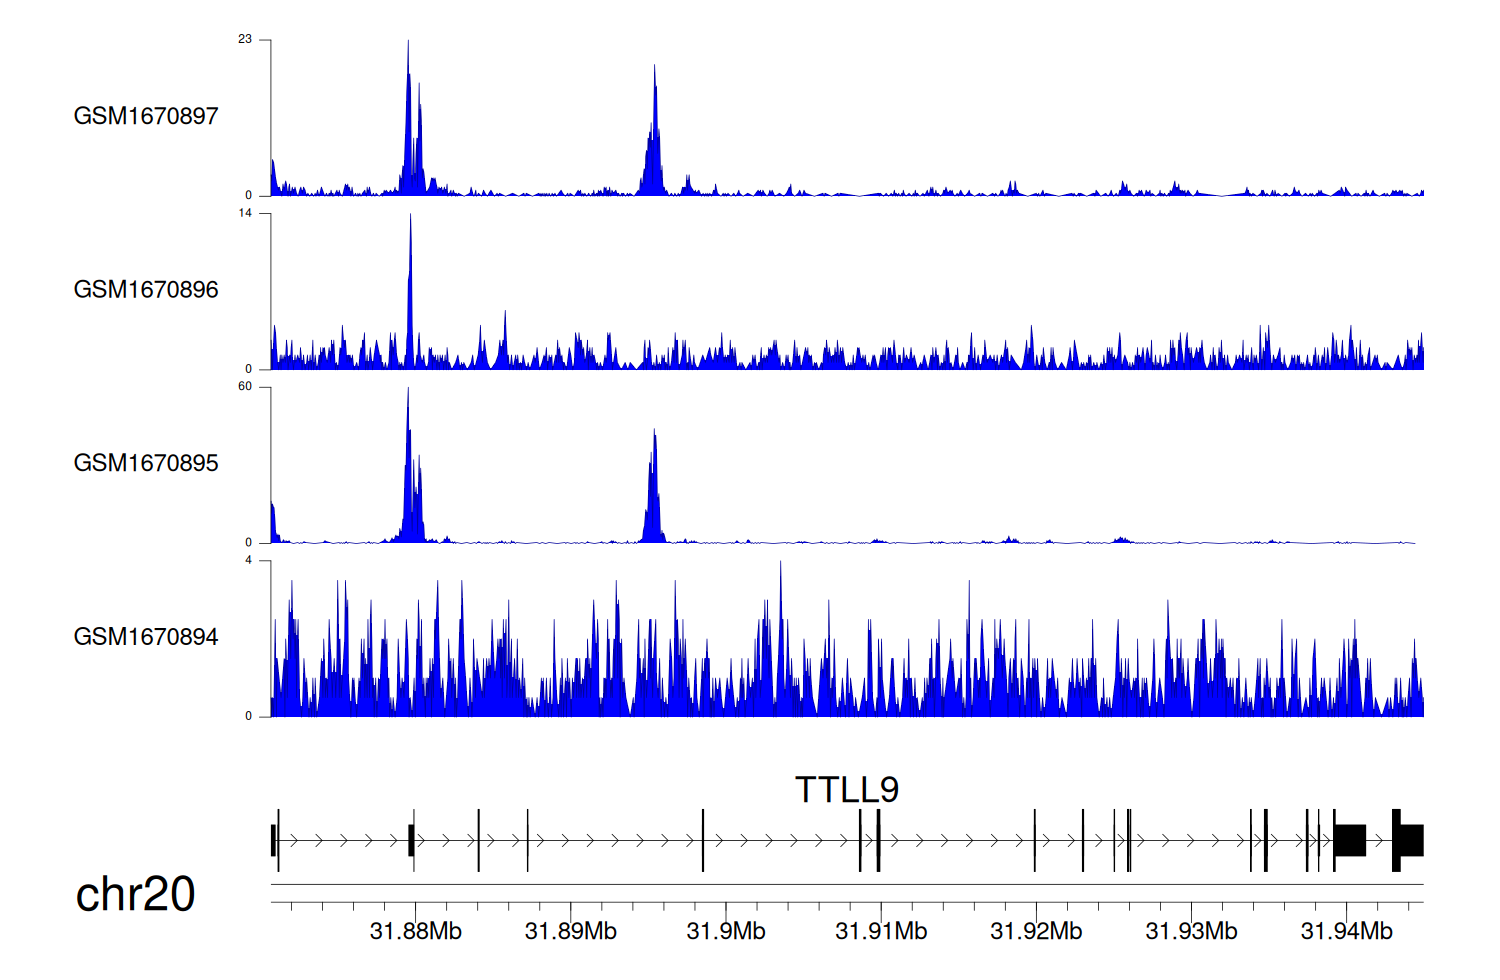
> Dataset: GSE35465 - TTLL9 peak across samples
|
Peak Plot

|
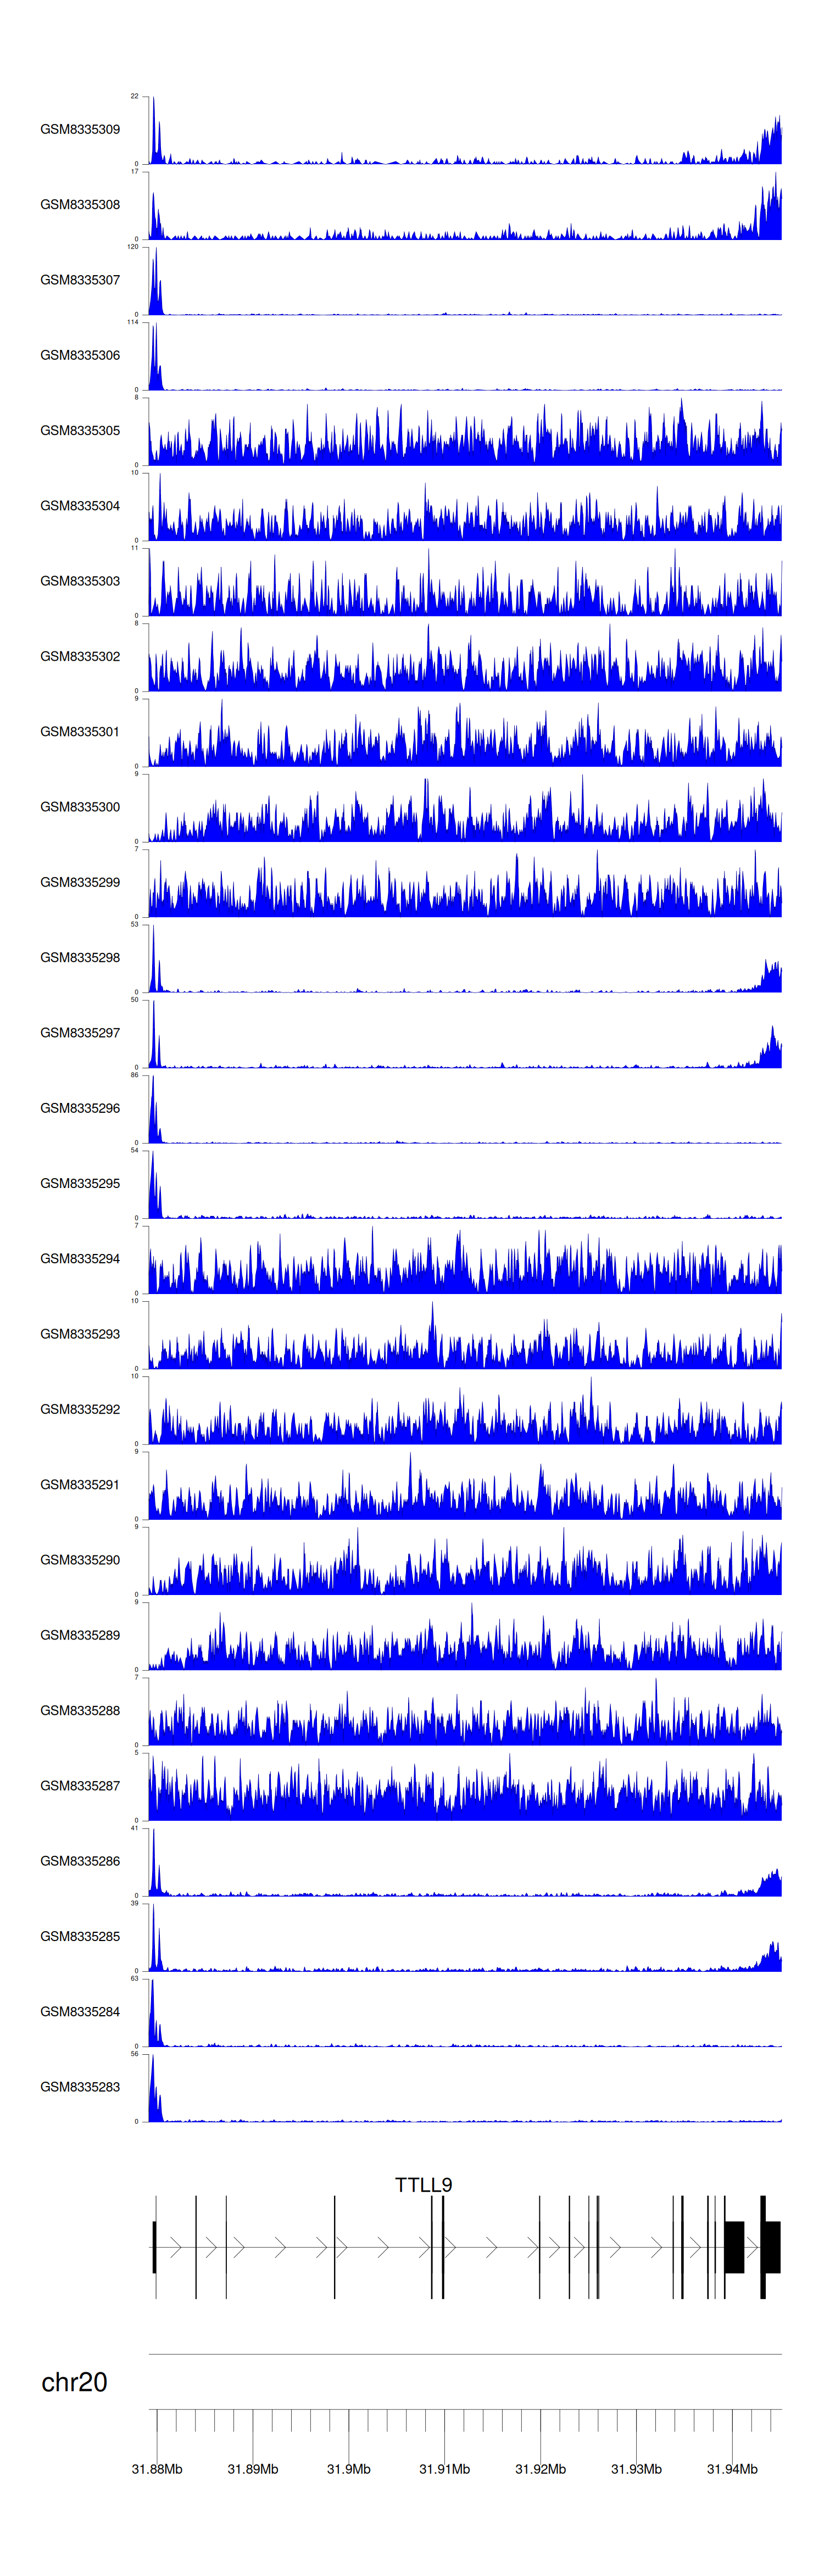
> Dataset: GSE68402 - TTLL9 peak across samples
|
Peak Plot
|
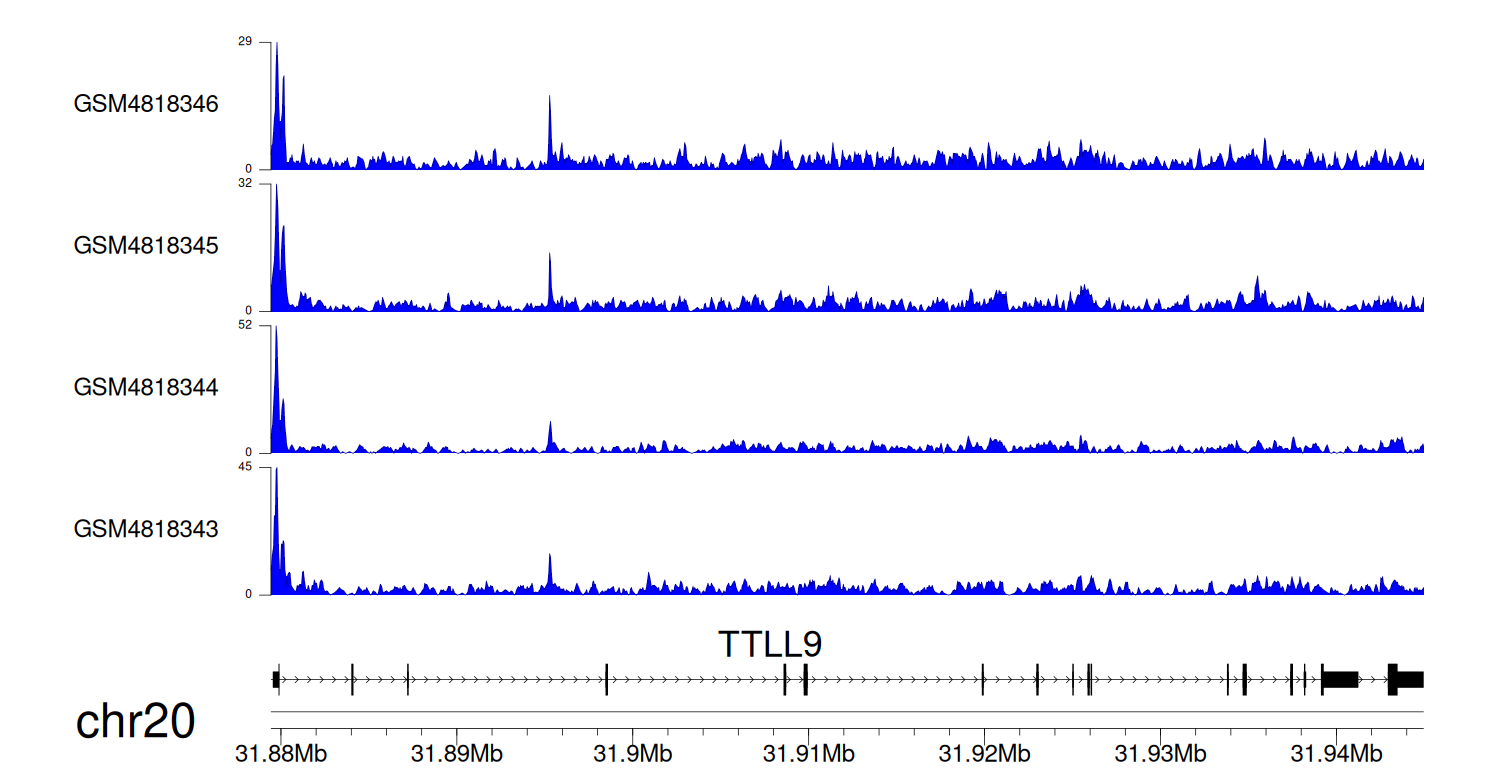
> Dataset: GSE270130 - TTLL9 peak across samples
|
Peak Plot
|
> Dataset: GSE131257 - TTLL9 peak across samples
|
Peak Plot
|
|
|
