Gene Information
|
Gene Name
|
WNT3 |
|
Gene ID
|
7473
|
|
Gene Full Name
|
Wnt family member 3 |
|
Gene Alias
|
INT4|TETAMS |
|
Transcripts
|
ENSG00000108379
|
|
Virus
|
HBV |
|
Gene Type
|
protein-coding |
|
HPA Location Info
|
Vesicles;Secreted to extracellular matrix; 
|
|
Membrane Info
|
Disease related genes, Human disease related genes, Predicted intracellular proteins, Predicted secreted proteins |
|
Uniport_ID
|
P56703
|
|
HGNC ID
|
HGNC:12782
|
|
OMIM ID
|
165330 |
|
Summary
|
The WNT gene family consists of structurally related genes which encode secreted signaling proteins. These proteins have been implicated in oncogenesis and in several developmental processes, including regulation of cell fate and patterning during embryogenesis. This gene is a member of the WNT gene family. It encodes a protein which shows 98% amino acid identity to mouse Wnt3 protein, and 84% to human WNT3A protein, another WNT gene product. The mouse studies show the requirement of Wnt3 in primary axis formation in the mouse. Studies of the gene expression suggest that this gene may play a key role in some cases of human breast, rectal, lung, and gastric cancer through activation of the WNT-beta-catenin-TCF signaling pathway. This gene is clustered with WNT15, another family member, in the chromosome 17q21 region. [provided by RefSeq, Jul 2008] |
Target gene [WNT3] related to VISs 
Integration Table: if previous studies reported that target gene was altered by virus integration events, the overlap between VISs in this literature and Cistrome factors was listed in this section
| DVID |
Chromosome |
HM |
TFBS |
CA |
Sum of Overlapped Records |
Detail |
| 1042271 |
chr17 |
101 |
4 |
0 |
105 |
View |
Target gene [WNT3] related to Omics data
| Data ID |
Experiment type |
Sample number |
Platform |
|
GSE236281
|
RNA-seq |
12 |
Illumina MiSeq (Homo sapiens) |
|
C GSE35465
|
Chip-seq;RNA-seq |
6 |
Illumina HiSeq 2000 (Homo sapiens) |
|
C GSE68402
|
Chip-seq |
26 |
Illumina MiSeq (Homo sapiens);Illumina HiSeq 2500 (Homo sapiens) |
|
TCGA_LIHC_HBV
|
DNA methylation sequencing;RNA-seq |
97 |
TCGA |
|
C GSE270130
|
Chip-seq |
27 |
Illumina NovaSeq 6000 (Homo sapiens) |
|
GSE224901
|
RNA-seq |
21 |
Illumina NovaSeq 6000 (Homo sapiens) |
|
C GSE100400
|
Chip-seq;RNA-seq;4C_cccDNA |
31 |
Illumina NextSeq 500 (Homo sapiens);Illumina NextSeq 500 (Mus musculus) |
|
GSE173897
|
RNA-seq |
95 |
Illumina HiSeq 4000 (Homo sapiens) |
|
GSE262515
|
RNA-seq |
21 |
Illumina HiSeq 2500 (Homo sapiens);Illumina HiSeq 2500 (Mus musculus) |
|
GSE110345
|
RNA-seq |
4 |
Illumina HiSeq 2500 (Homo sapiens) |
|
C GSE131257
|
ATAC-seq;RNA-seq |
19 |
Illumina HiSeq 2500 (Homo sapiens) |
|
GSE94660
|
RNA-seq |
42 |
Illumina HiSeq 2500 (Homo sapiens) |
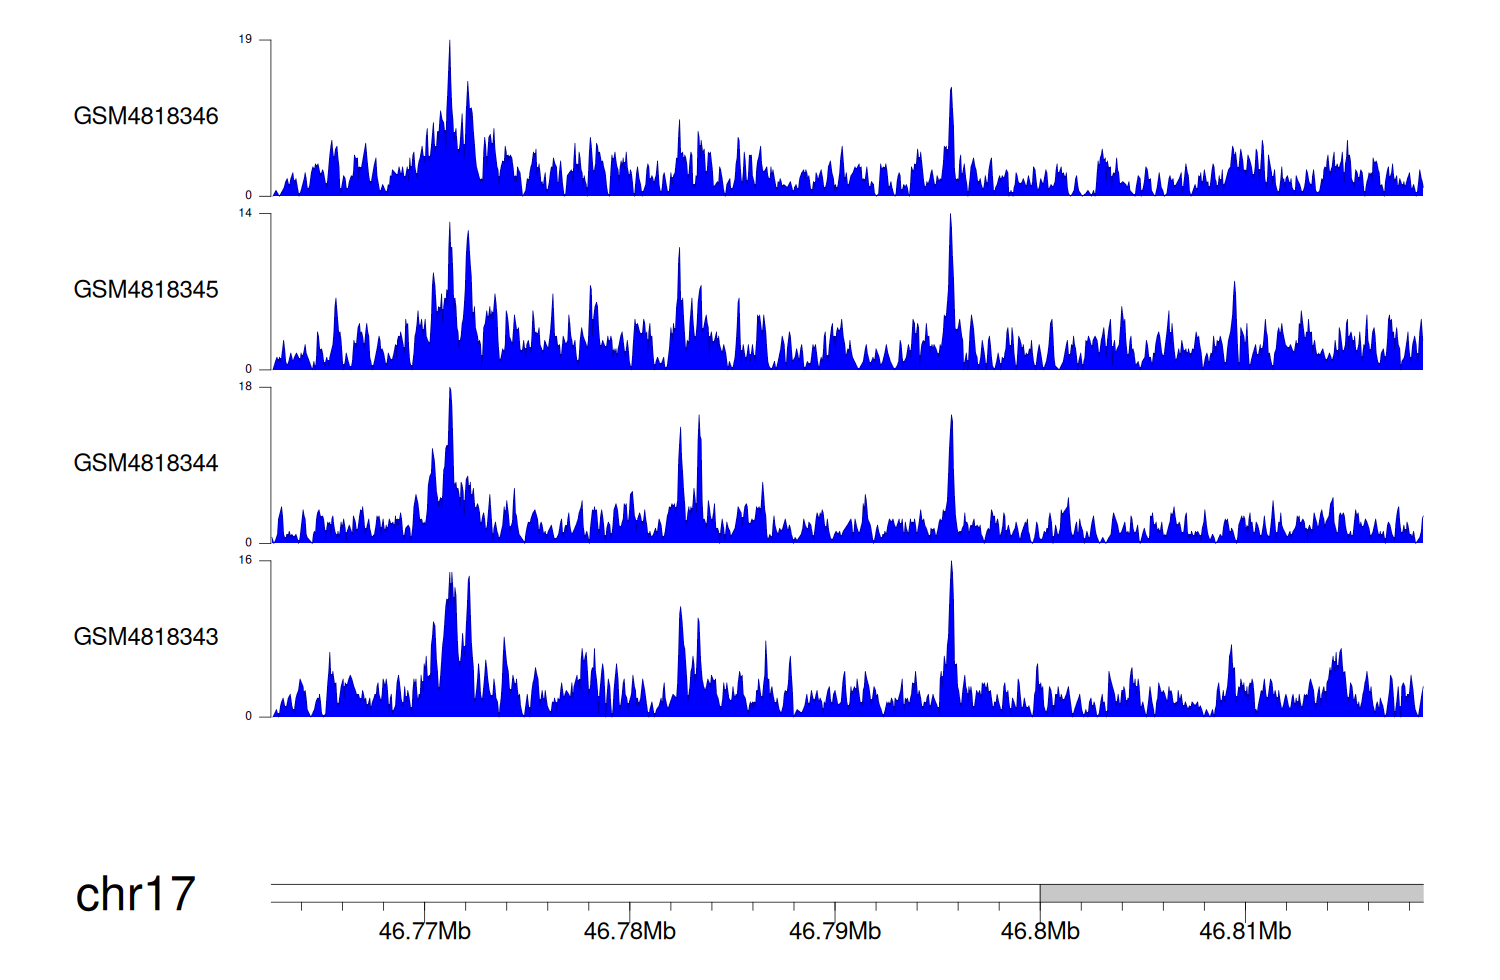
When the gene can detect a peak in the dataset, a peak plot will be displayed.
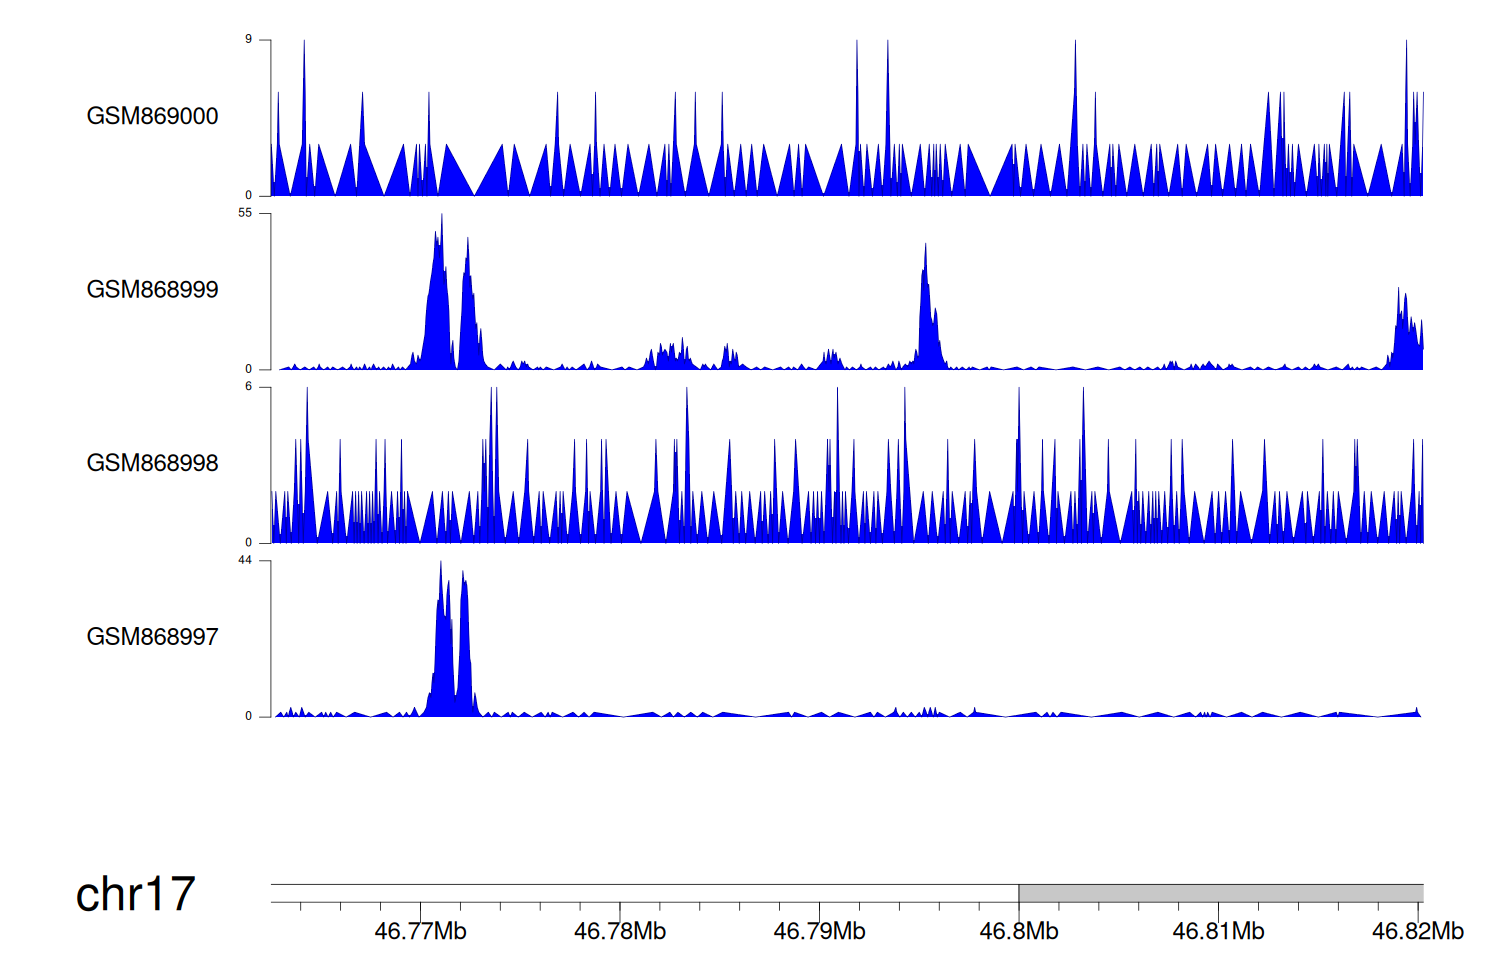
> Dataset: GSE35465 - WNT3 peak across samples
|
Peak Plot
|
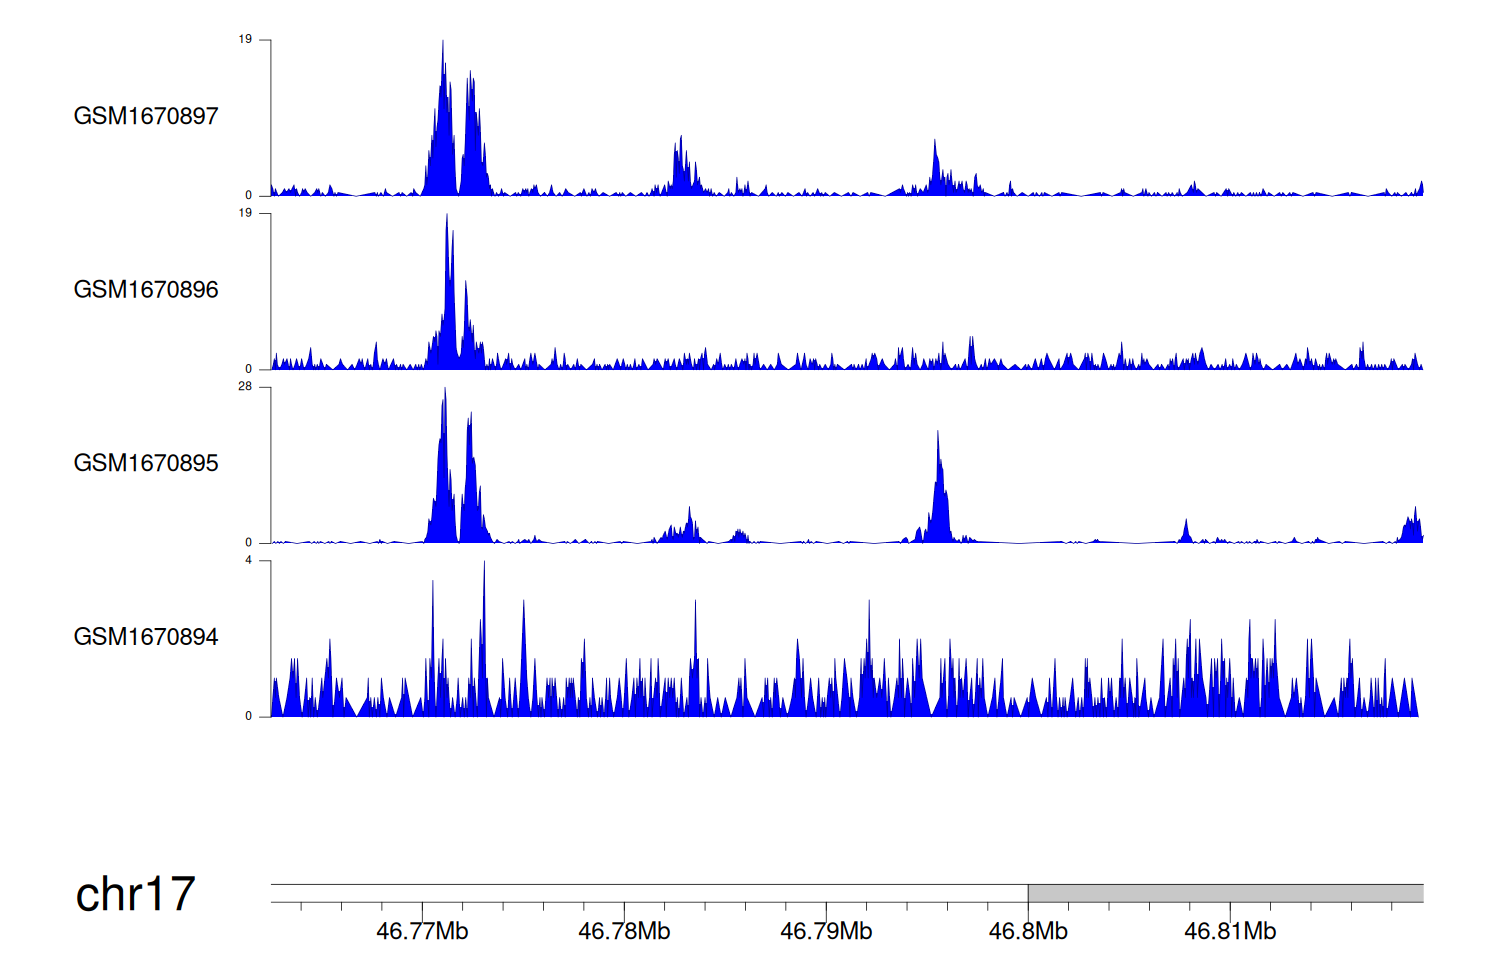
> Dataset: GSE68402 - WNT3 peak across samples
|
Peak Plot
|
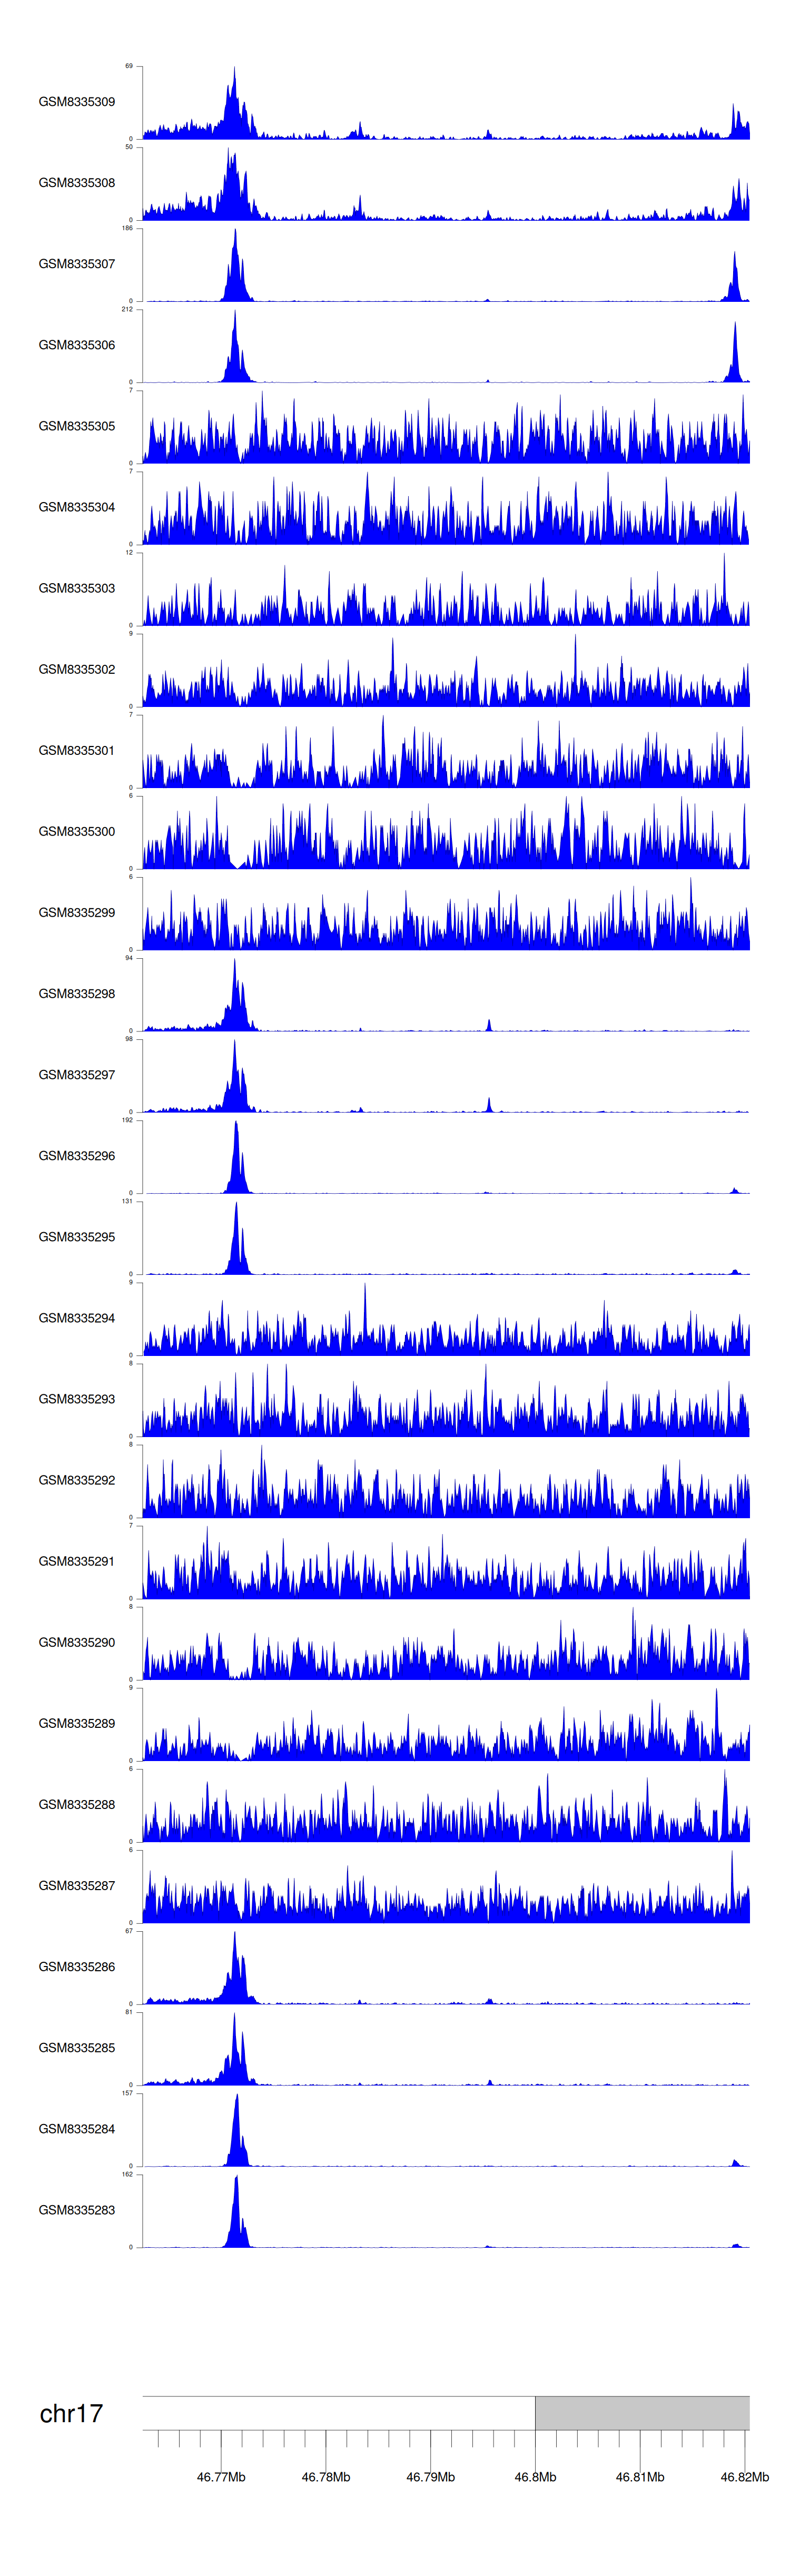
> Dataset: GSE270130 - WNT3 peak across samples
|
Peak Plot
|
> Dataset: GSE100400 - WNT3 peak across samples
|
Peak Plot
|
> Dataset: GSE131257 - WNT3 peak across samples
|
Peak Plot
|
|
|
