Gene Information
|
Gene Name
|
ABCC12 |
|
Gene ID
|
94160
|
|
Gene Full Name
|
ATP binding cassette subfamily C member 12 |
|
Gene Alias
|
MRP9 |
|
Transcripts
|
ENSG00000140798
|
|
Virus
|
HTLV1 |
|
Gene Type
|
protein-coding |
|
HPA Location Info
|

|
|
Membrane Info
|
Predicted intracellular proteins, Predicted membrane proteins |
|
HGNC ID
|
HGNC:14640
|
|
OMIM ID
|
607041 |
|
Summary
|
This gene is a member of the superfamily of ATP-binding cassette (ABC) transporters and the encoded protein contains two ATP-binding domains and 12 transmembrane regions. ABC proteins transport various molecules across extra- and intracellular membranes. ABC genes are divided into seven distinct subfamilies: ABC1, MDR/TAP, MRP, ALD, OABP, GCN20, and White. This gene is a member of the MRP subfamily which is involved in multi-drug resistance. This gene and another subfamily member are arranged head-to-tail on chromosome 16q12.1. Increased expression of this gene is associated with breast cancer. [provided by RefSeq, Jul 2008] |
Target gene [ABCC12] related to VISs 
Integration Table: if previous studies reported that target gene was altered by virus integration events, the overlap between VISs in this literature and Cistrome factors was listed in this section
| DVID |
Chromosome |
HM |
TFBS |
CA |
Sum of Overlapped Records |
Detail |
| 6015283 |
chr16 |
9 |
4 |
1 |
14 |
View |
Target gene [ABCC12] related to Omics data
| Data ID |
Experiment type |
Sample number |
Platform |
|
C GSE94732
|
Chip-seq |
24 |
Illumina NextSeq 500 (Homo sapiens);illumina Genome Analyzer IIx (Homo sapiens) |
|
GSE168557
|
Expression array |
6 |
Agilent-039494 SurePrint G3 Human GE v2 8x60K Microarray 039381 (Feature Number version) |
|
GSE52244
|
Expression array |
15 |
[HuEx-1_0-st] Affymetrix Human Exon 1.0 ST Array [probe set (exon) version] |
|
GSE189602
|
Methylation profiling (Array) |
4 |
Infinium MethylationEPIC |
|
GSE136189
|
Methylation profiling (Array) |
40 |
Illumina HumanMethylation450 BeadChip (HumanMethylation450_15017482);Illumina Infinium HumanMethylation850 BeadChip |
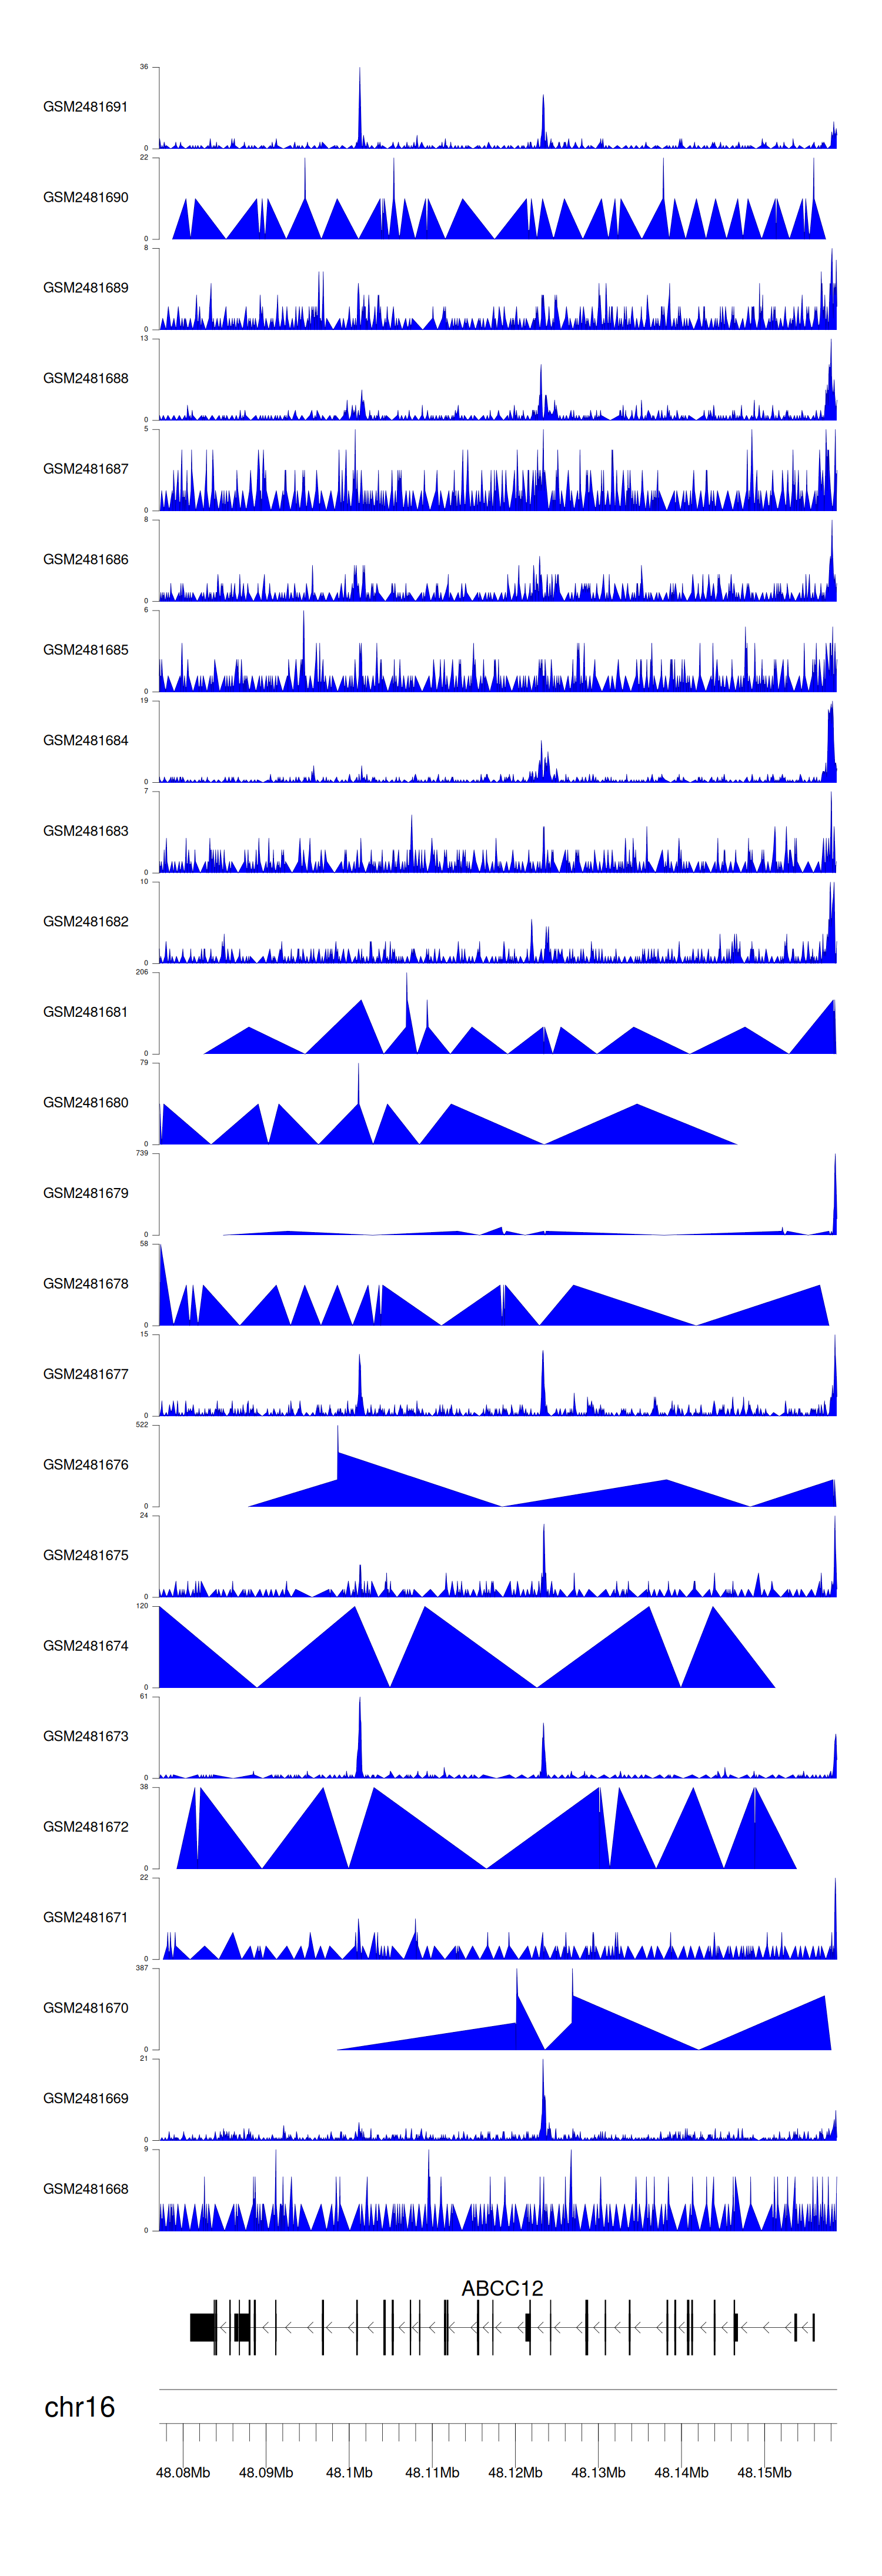
When the gene can detect a peak in the dataset, a peak plot will be displayed.
> Dataset: GSE94732 - ABCC12 peak across samples
|
Peak Plot
|
|
|
