Gene Information
|
Gene Name
|
ACO1 |
|
Gene ID
|
48
|
|
Gene Full Name
|
aconitase 1 |
|
Gene Alias
|
ACONS|HEL60|IREB1|IREBP|IREBP1|IRP1 |
|
Transcripts
|
ENSG00000122729
|
|
Virus
|
HBV |
|
Gene Type
|
protein-coding |
|
HPA Location Info
|
Mitochondria, Cytosol; 
|
|
Membrane Info
|
Cancer-related genes, Citric acid cycle related proteins, Enzymes, Metabolic proteins, Plasma proteins, Predicted intracellular proteins |
|
Uniport_ID
|
P21399
|
|
HGNC ID
|
HGNC:117
|
|
OMIM ID
|
100880 |
|
Summary
|
The protein encoded by this gene is a bifunctional, cytosolic protein that functions as an essential enzyme in the TCA cycle and interacts with mRNA to control the levels of iron inside cells. When cellular iron levels are high, this protein binds to a 4Fe-4S cluster and functions as an aconitase. Aconitases are iron-sulfur proteins that function to catalyze the conversion of citrate to isocitrate. When cellular iron levels are low, the protein binds to iron-responsive elements (IREs), which are stem-loop structures found in the 5' UTR of ferritin mRNA, and in the 3' UTR of transferrin receptor mRNA. When the protein binds to IRE, it results in repression of translation of ferritin mRNA, and inhibition of degradation of the otherwise rapidly degraded transferrin receptor mRNA. The encoded protein has been identified as a moonlighting protein based on its ability to perform mechanistically distinct functions. Alternative splicing results in multiple transcript variants [provided by RefSeq, Jan 2014] |
Target gene [ACO1] related to VISs 
Integration Table: if previous studies reported that target gene was altered by virus integration events, the overlap between VISs in this literature and Cistrome factors was listed in this section
| DVID |
Chromosome |
HM |
TFBS |
CA |
Sum of Overlapped Records |
Detail |
| 1020038 |
chr9 |
21 |
0 |
0 |
21 |
View |
Target gene [ACO1] related to Omics data
| Data ID |
Experiment type |
Sample number |
Platform |
|
GSE236281
|
RNA-seq |
12 |
Illumina MiSeq (Homo sapiens) |
|
C GSE35465
|
Chip-seq;RNA-seq |
6 |
Illumina HiSeq 2000 (Homo sapiens) |
|
S GSE199850
|
scRNA-seq |
1 |
HiSeq X Ten (Homo sapiens) |
|
C GSE68402
|
Chip-seq |
26 |
Illumina MiSeq (Homo sapiens);Illumina HiSeq 2500 (Homo sapiens) |
|
GSE247322
|
scRNA-seq |
27 |
Illumina NovaSeq 6000 (Homo sapiens) |
|
TCGA_LIHC_HBV
|
DNA methylation sequencing;RNA-seq |
97 |
TCGA |
|
C GSE270130
|
Chip-seq |
27 |
Illumina NovaSeq 6000 (Homo sapiens) |
|
GSE224901
|
RNA-seq |
21 |
Illumina NovaSeq 6000 (Homo sapiens) |
|
E C GSE100400
|
Chip-seq;RNA-seq;4C_cccDNA |
31 |
Illumina NextSeq 500 (Homo sapiens);Illumina NextSeq 500 (Mus musculus) |
|
GSE173897
|
RNA-seq |
95 |
Illumina HiSeq 4000 (Homo sapiens) |
|
GSE262515
|
RNA-seq |
21 |
Illumina HiSeq 2500 (Homo sapiens);Illumina HiSeq 2500 (Mus musculus) |
|
GSE110345
|
RNA-seq |
4 |
Illumina HiSeq 2500 (Homo sapiens) |
|
C GSE131257
|
ATAC-seq;RNA-seq |
19 |
Illumina HiSeq 2500 (Homo sapiens) |
|
GSE94660
|
RNA-seq |
42 |
Illumina HiSeq 2500 (Homo sapiens) |
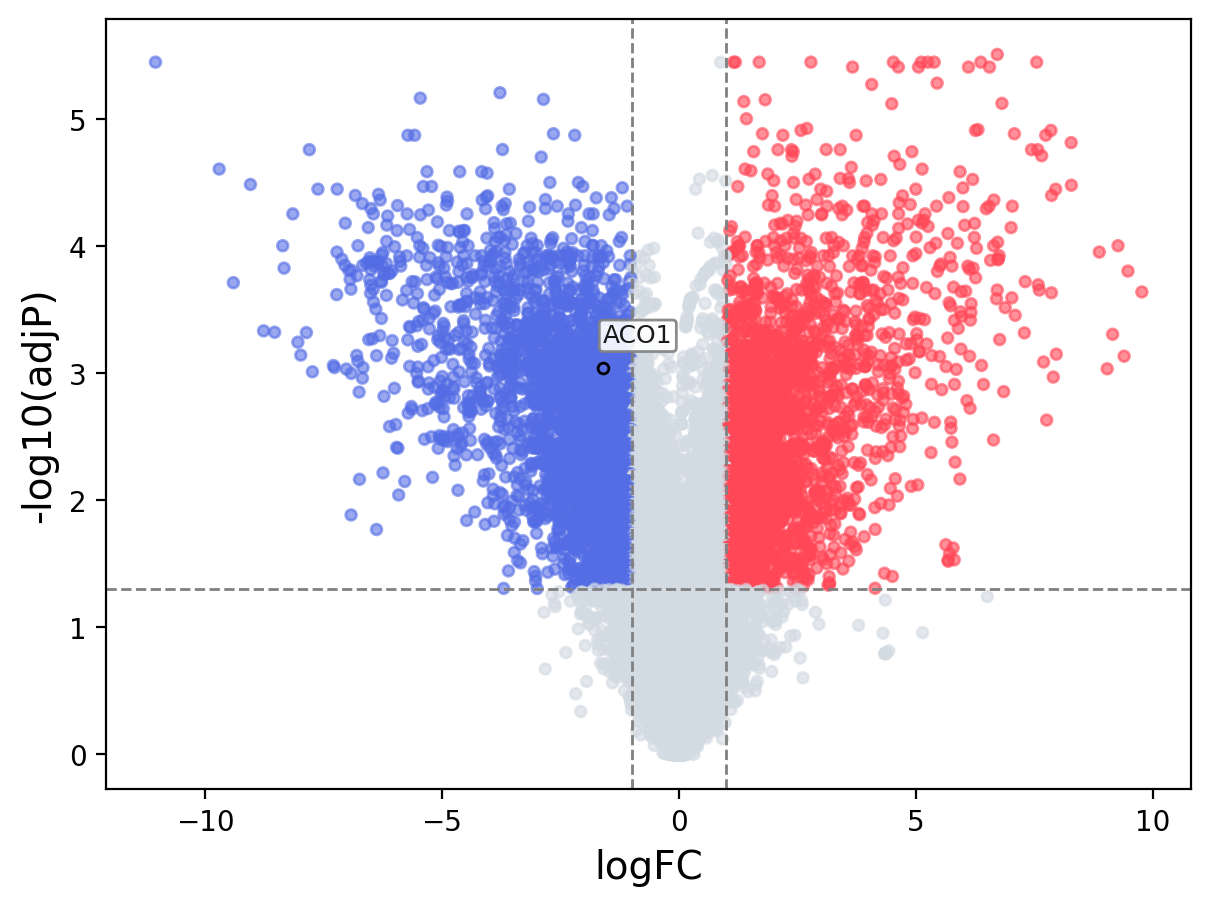
When the query gene is differentially changed in the dataset, a volcano/bar plot will be displayed.
> Dataset: GSE100400 - ACO1 expression across samples
|
Volcano Plot
|
Bar Plot
|
|
|
