Gene Information
|
Gene Name
|
ACP5 |
|
Gene ID
|
54
|
|
Gene Full Name
|
acid phosphatase 5, tartrate resistant |
|
Gene Alias
|
HPAP|TRACP5a|TRACP5b|TRAP|TRAcP|TrATPase |
|
Transcripts
|
ENSG00000102575
|
|
Virus
|
HTLV1 |
|
Gene Type
|
protein-coding |
|
HPA Location Info
|
Cytosol;Intracellular and membrane; 
|
|
Membrane Info
|
Disease related genes, Enzymes, Human disease related genes, Metabolic proteins, Plasma proteins, Potential drug targets, Predicted intracellular proteins |
|
Uniport_ID
|
P13686
|
|
HGNC ID
|
HGNC:124
|
|
OMIM ID
|
171640 |
|
Summary
|
This gene encodes an iron containing glycoprotein which catalyzes the conversion of orthophosphoric monoester to alcohol and orthophosphate. It is the most basic of the acid phosphatases and is the only form not inhibited by L(+)-tartrate. [provided by RefSeq, Aug 2008] |
Target gene [ACP5] related to VISs 
Integration Table: if previous studies reported that target gene was altered by virus integration events, the overlap between VISs in this literature and Cistrome factors was listed in this section
| DVID |
Chromosome |
HM |
TFBS |
CA |
Sum of Overlapped Records |
Detail |
| 6001995 |
chr19 |
225 |
41 |
37 |
303 |
View |
Target gene [ACP5] related to Omics data
| Data ID |
Experiment type |
Sample number |
Platform |
|
GSE189602
|
Methylation profiling (Array) |
4 |
Infinium MethylationEPIC |
|
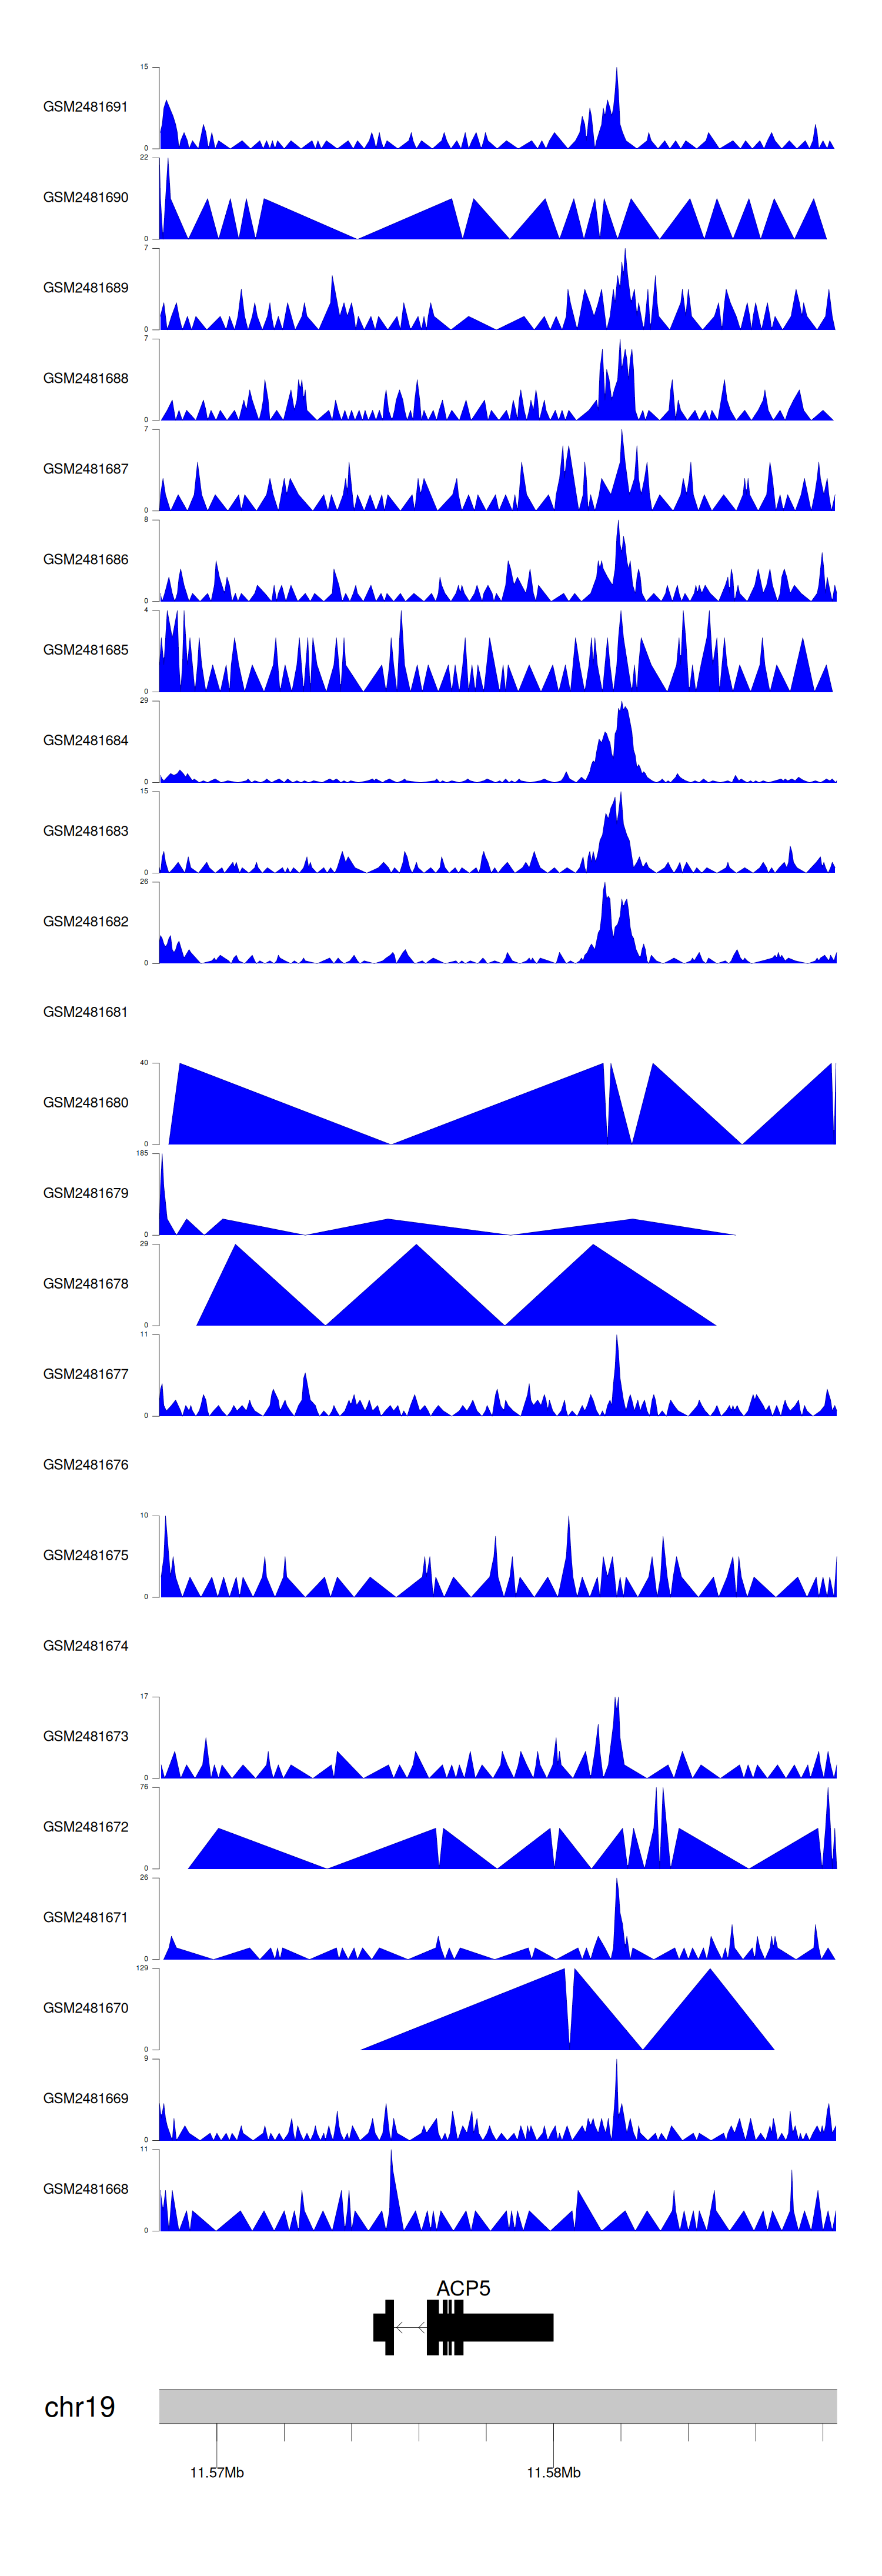
C GSE94732
|
Chip-seq |
24 |
Illumina NextSeq 500 (Homo sapiens);illumina Genome Analyzer IIx (Homo sapiens) |
|
GSE52244
|
Expression array |
15 |
[HuEx-1_0-st] Affymetrix Human Exon 1.0 ST Array [probe set (exon) version] |
|
GSE10789
|
Expression array |
6 |
NCI/ATC Hs-OperonV3 |
|
GSE224047
|
RNA-seq |
10 |
Illumina NextSeq 500 (Homo sapiens) |
|
GSE168557
|
Expression array |
6 |
Agilent-039494 SurePrint G3 Human GE v2 8x60K Microarray 039381 (Feature Number version) |
|
GSE136189
|
Methylation profiling (Array) |
40 |
Illumina HumanMethylation450 BeadChip (HumanMethylation450_15017482);Illumina Infinium HumanMethylation850 BeadChip |
When the gene can detect a peak in the dataset, a peak plot will be displayed.
> Dataset: GSE94732 - ACP5 peak across samples
|
Peak Plot
|
|
|
