Gene Information
|
Gene Name
|
ADGRB1 |
|
Gene ID
|
575
|
|
Gene Full Name
|
adhesion G protein-coupled receptor B1 |
|
Gene Alias
|
BAI1|GDAIF |
|
Transcripts
|
ENSG00000181790
|
|
Virus
|
HBV |
|
Gene Type
|
protein-coding |
|
HPA Location Info
|
Secreted in brain; 
|
|
Membrane Info
|
Cancer-related genes, G-protein coupled receptors, Plasma proteins, Predicted membrane proteins, Predicted secreted proteins |
|
Uniport_ID
|
O14514
|
|
HGNC ID
|
HGNC:943
|
|
OMIM ID
|
602682 |
|
Summary
|
Angiogenesis is controlled by a local balance between stimulators and inhibitors of new vessel growth and is suppressed under normal physiologic conditions. Angiogenesis has been shown to be essential for growth and metastasis of solid tumors. In order to obtain blood supply for their growth, tumor cells are potently angiogenic and attract new vessels as results of increased secretion of inducers and decreased production of endogenous negative regulators. BAI1 contains at least one 'functional' p53-binding site within an intron, and its expression has been shown to be induced by wildtype p53. There are two other brain-specific angiogenesis inhibitor genes, designated BAI2 and BAI3 which along with BAI1 have similar tissue specificities and structures, however only BAI1 is transcriptionally regulated by p53. BAI1 is postulated to be a member of the secretin receptor family, an inhibitor of angiogenesis and a growth suppressor of glioblastomas [provided by RefSeq, Jul 2008] |
Target gene [ADGRB1] related to VISs 
Integration Table: if previous studies reported that target gene was altered by virus integration events, the overlap between VISs in this literature and Cistrome factors was listed in this section
| DVID |
Chromosome |
HM |
TFBS |
CA |
Sum of Overlapped Records |
Detail |
| 1013046 |
chr8 |
3 |
2 |
0 |
5 |
View |
| 1024792 |
chr8 |
1 |
0 |
0 |
1 |
View |
Target gene [ADGRB1] related to Omics data
| Data ID |
Experiment type |
Sample number |
Platform |
|
GSE236281
|
RNA-seq |
12 |
Illumina MiSeq (Homo sapiens) |
|
C GSE35465
|
Chip-seq;RNA-seq |
6 |
Illumina HiSeq 2000 (Homo sapiens) |
|
C GSE68402
|
Chip-seq |
26 |
Illumina MiSeq (Homo sapiens);Illumina HiSeq 2500 (Homo sapiens) |
|
TCGA_LIHC_HBV
|
DNA methylation sequencing;RNA-seq |
97 |
TCGA |
|
C GSE270130
|
Chip-seq |
27 |
Illumina NovaSeq 6000 (Homo sapiens) |
|
C GSE64877
|
Chip-seq |
2 |
Illumina Genome Analyzer (Homo sapiens) |
|
GSE224901
|
RNA-seq |
21 |
Illumina NovaSeq 6000 (Homo sapiens) |
|
GSE100400
|
Chip-seq;RNA-seq;4C_cccDNA |
31 |
Illumina NextSeq 500 (Homo sapiens);Illumina NextSeq 500 (Mus musculus) |
|
GSE173897
|
RNA-seq |
95 |
Illumina HiSeq 4000 (Homo sapiens) |
|
GSE262515
|
RNA-seq |
21 |
Illumina HiSeq 2500 (Homo sapiens);Illumina HiSeq 2500 (Mus musculus) |
|
C GSE131257
|
ATAC-seq;RNA-seq |
19 |
Illumina HiSeq 2500 (Homo sapiens) |
|
GSE94660
|
RNA-seq |
42 |
Illumina HiSeq 2500 (Homo sapiens) |
When the gene can detect a peak in the dataset, a peak plot will be displayed.
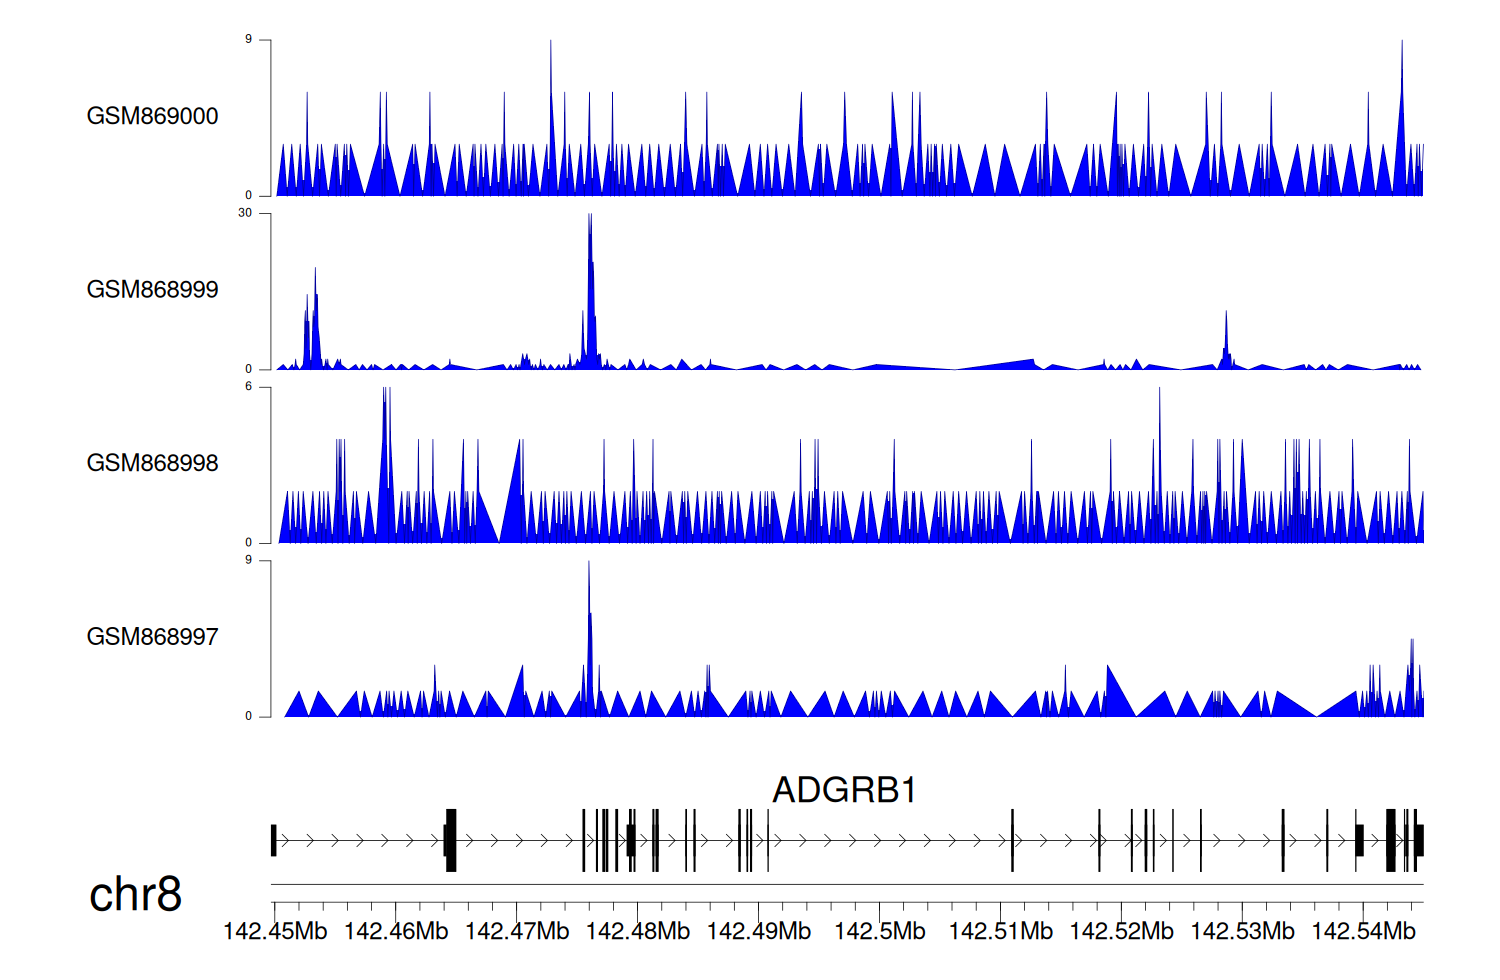
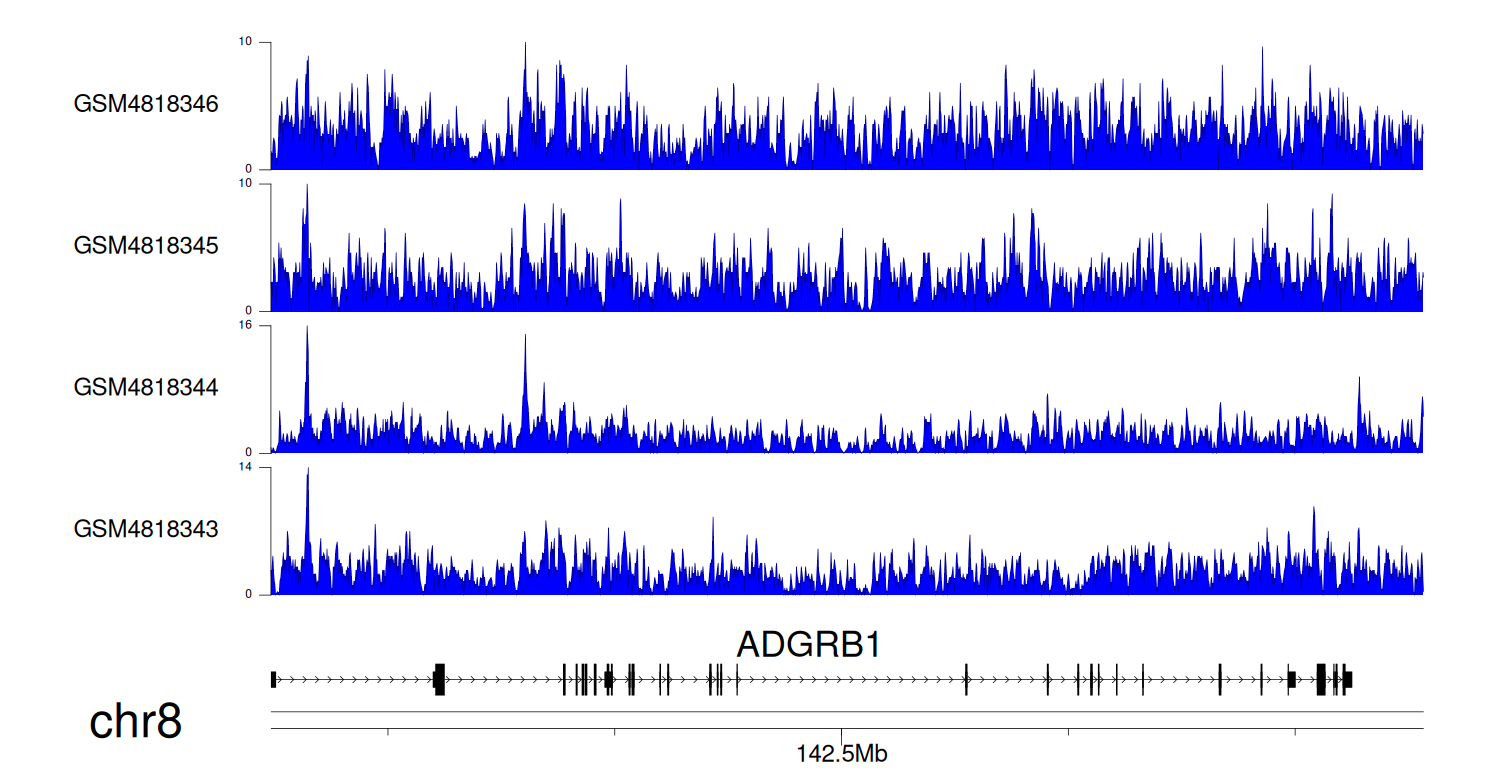
> Dataset: GSE35465 - ADGRB1 peak across samples
|
Peak Plot
|
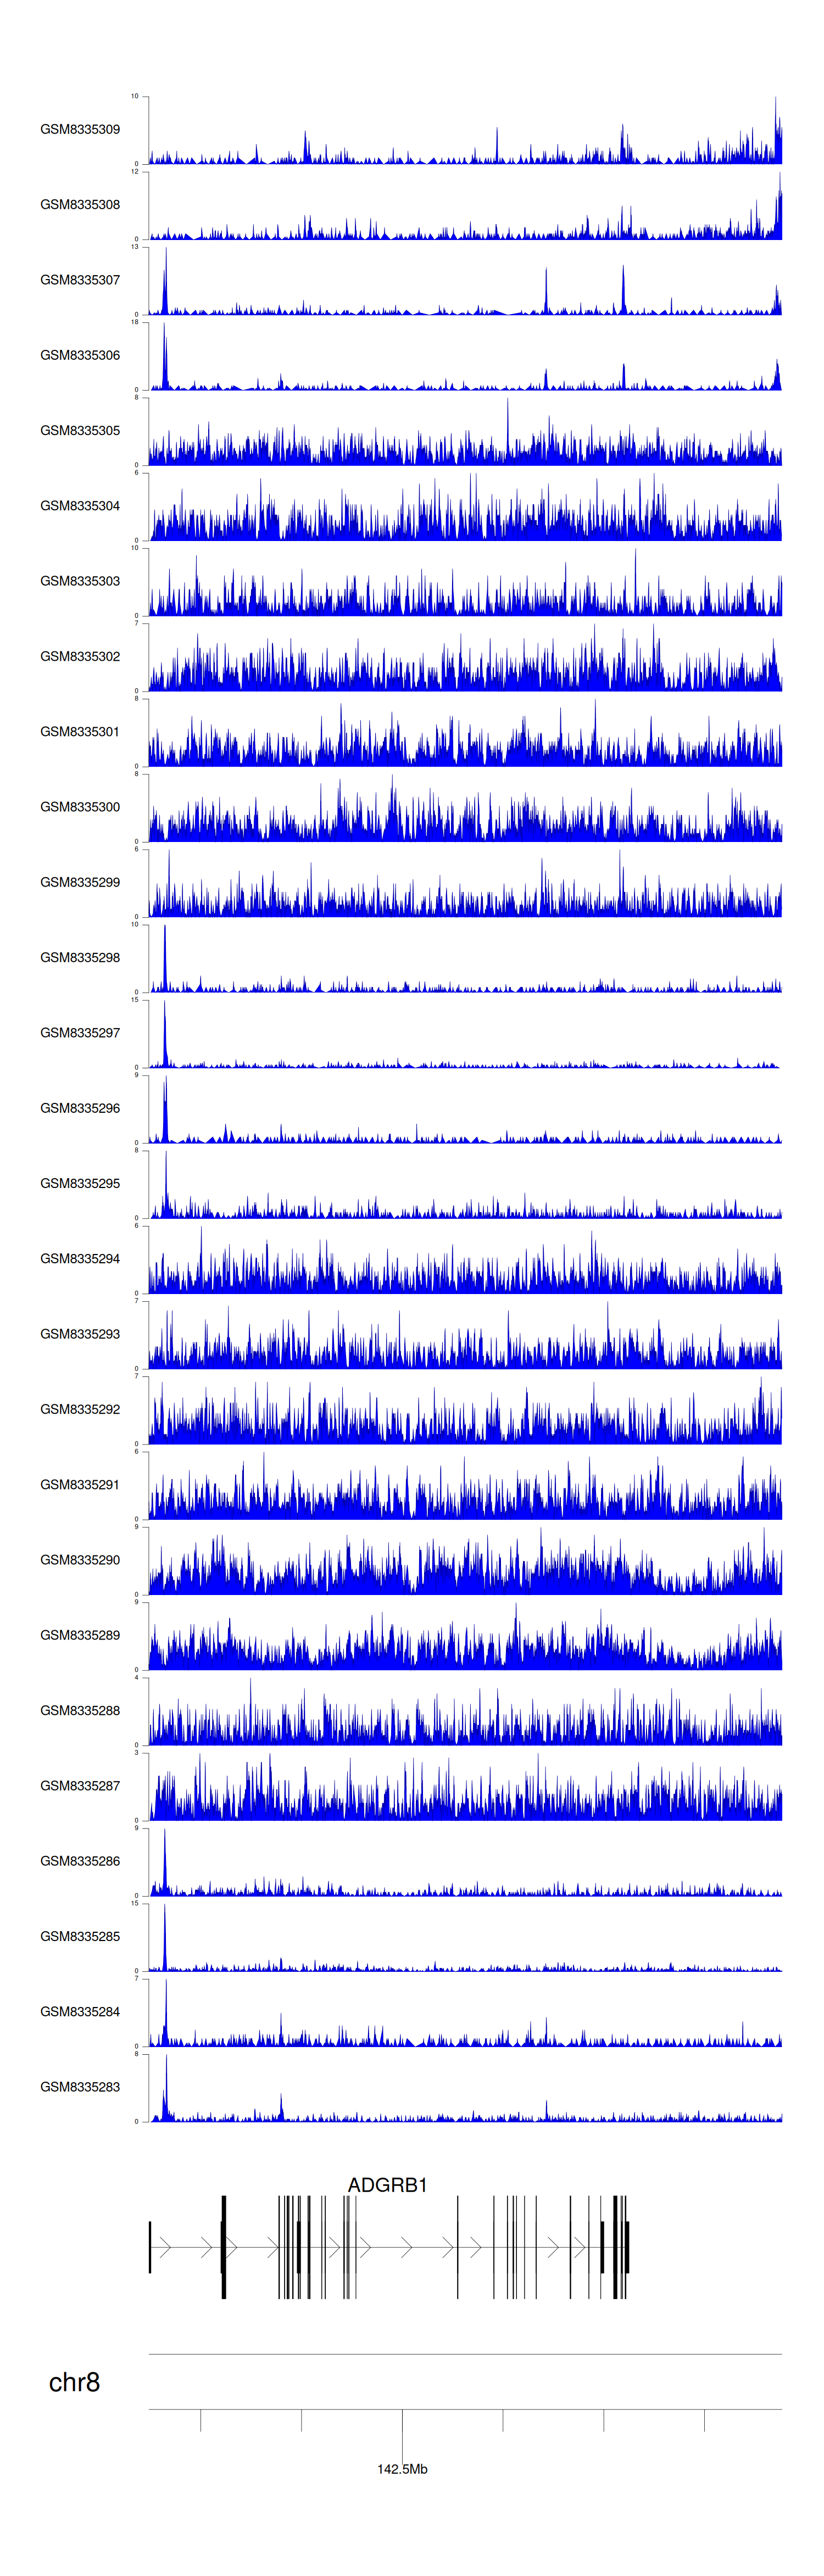
> Dataset: GSE68402 - ADGRB1 peak across samples
|
Peak Plot
|
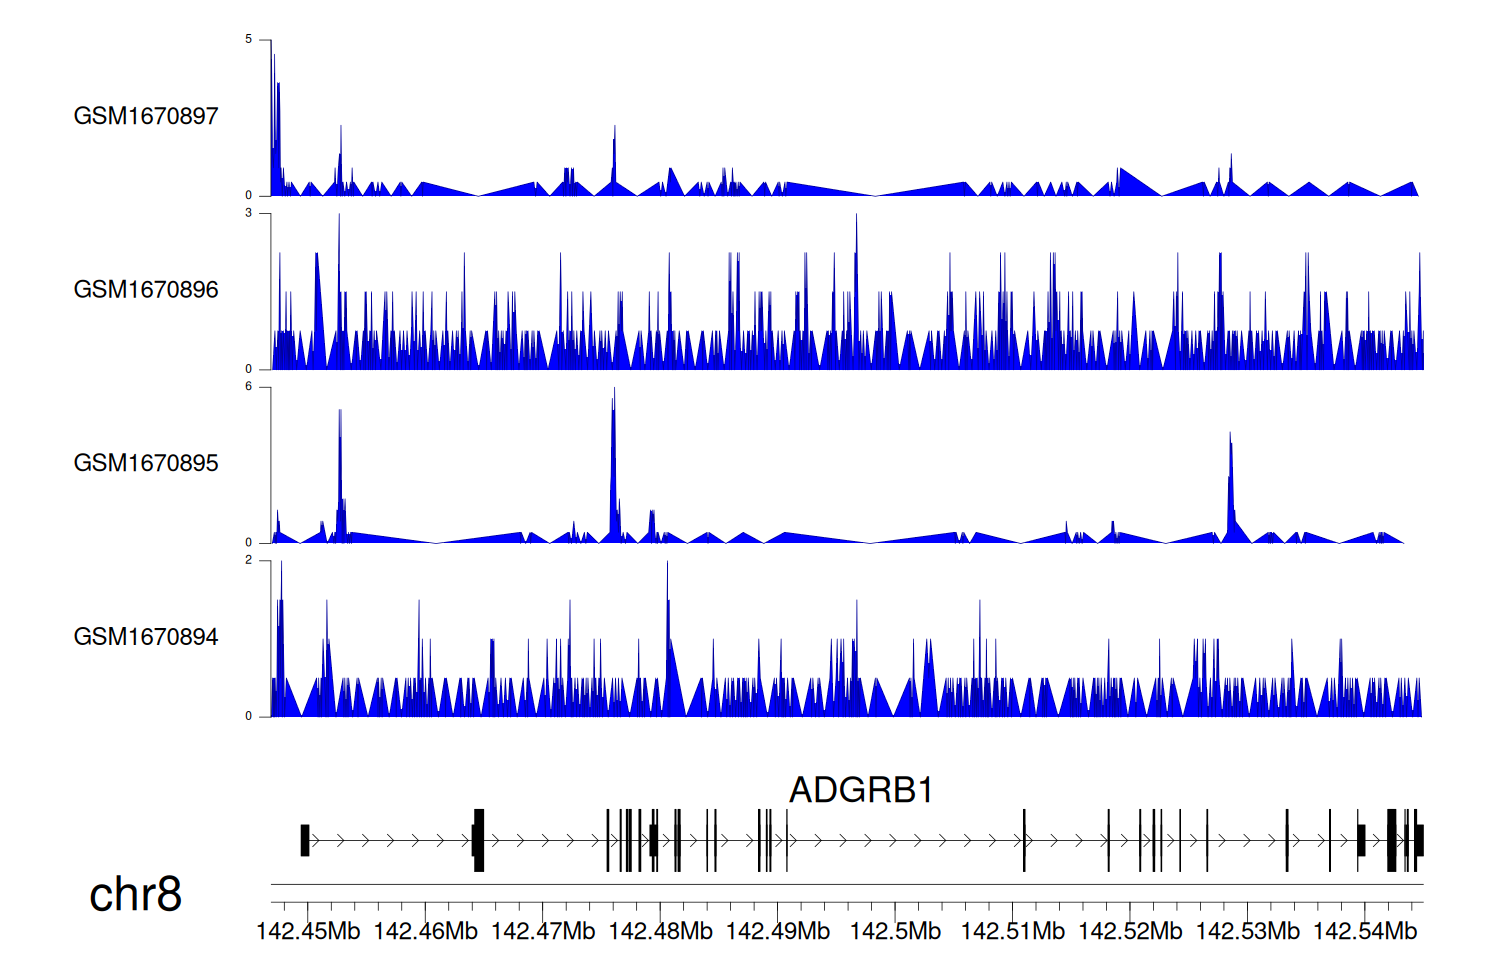
> Dataset: GSE270130 - ADGRB1 peak across samples
|
Peak Plot
|
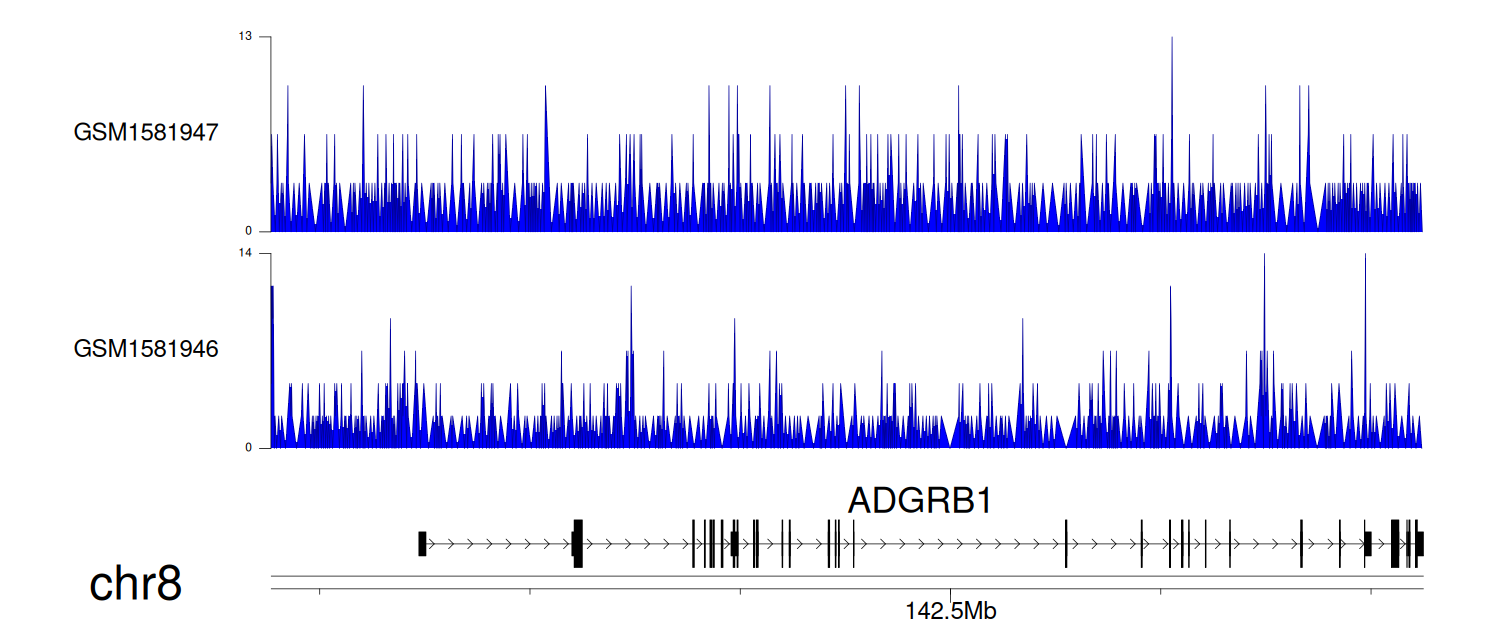
> Dataset: GSE64877 - ADGRB1 peak across samples
|
Peak Plot
|
> Dataset: GSE131257 - ADGRB1 peak across samples
|
Peak Plot
|
|
|
