Gene Information
|
Gene Name
|
ADGRB3 |
|
Gene ID
|
577
|
|
Gene Full Name
|
adhesion G protein-coupled receptor B3 |
|
Gene Alias
|
BAI3 |
|
Transcripts
|
ENSG00000135298
|
|
Virus
|
HBV |
|
Gene Type
|
protein-coding |
|
HPA Location Info
|

|
|
Membrane Info
|
G-protein coupled receptors, Plasma proteins, Predicted membrane proteins, Transporters |
|
Uniport_ID
|
O60242
|
|
HGNC ID
|
HGNC:945
|
|
OMIM ID
|
602684 |
|
Summary
|
This p53-target gene encodes a brain-specific angiogenesis inhibitor, a seven-span transmembrane protein, and is thought to be a member of the secretin receptor family. Brain-specific angiogenesis proteins BAI2 and BAI3 are similar to BAI1 in structure, have similar tissue specificities, and may also play a role in angiogenesis. [provided by RefSeq, Jul 2008] |
Target gene [ADGRB3] related to VISs 
Integration Table: if previous studies reported that target gene was altered by virus integration events, the overlap between VISs in this literature and Cistrome factors was listed in this section
| DVID |
Chromosome |
HM |
TFBS |
CA |
Sum of Overlapped Records |
Detail |
| 1019720 |
chr6 |
0 |
0 |
0 |
0 |
View |
| 1043168 |
chr6 |
7 |
0 |
0 |
7 |
View |
Target gene [ADGRB3] related to Omics data
| Data ID |
Experiment type |
Sample number |
Platform |
|
GSE236281
|
RNA-seq |
12 |
Illumina MiSeq (Homo sapiens) |
|
C GSE35465
|
Chip-seq;RNA-seq |
6 |
Illumina HiSeq 2000 (Homo sapiens) |
|
C GSE68402
|
Chip-seq |
26 |
Illumina MiSeq (Homo sapiens);Illumina HiSeq 2500 (Homo sapiens) |
|
GSE247322
|
scRNA-seq |
27 |
Illumina NovaSeq 6000 (Homo sapiens) |
|
TCGA_LIHC_HBV
|
DNA methylation sequencing;RNA-seq |
97 |
TCGA |
|
C GSE270130
|
Chip-seq |
27 |
Illumina NovaSeq 6000 (Homo sapiens) |
|
GSE224901
|
RNA-seq |
21 |
Illumina NovaSeq 6000 (Homo sapiens) |
|
C GSE100400
|
Chip-seq;RNA-seq;4C_cccDNA |
31 |
Illumina NextSeq 500 (Homo sapiens);Illumina NextSeq 500 (Mus musculus) |
|
GSE173897
|
RNA-seq |
95 |
Illumina HiSeq 4000 (Homo sapiens) |
|
GSE262515
|
RNA-seq |
21 |
Illumina HiSeq 2500 (Homo sapiens);Illumina HiSeq 2500 (Mus musculus) |
|
C GSE131257
|
ATAC-seq;RNA-seq |
19 |
Illumina HiSeq 2500 (Homo sapiens) |
|
GSE94660
|
RNA-seq |
42 |
Illumina HiSeq 2500 (Homo sapiens) |
When the gene can detect a peak in the dataset, a peak plot will be displayed.
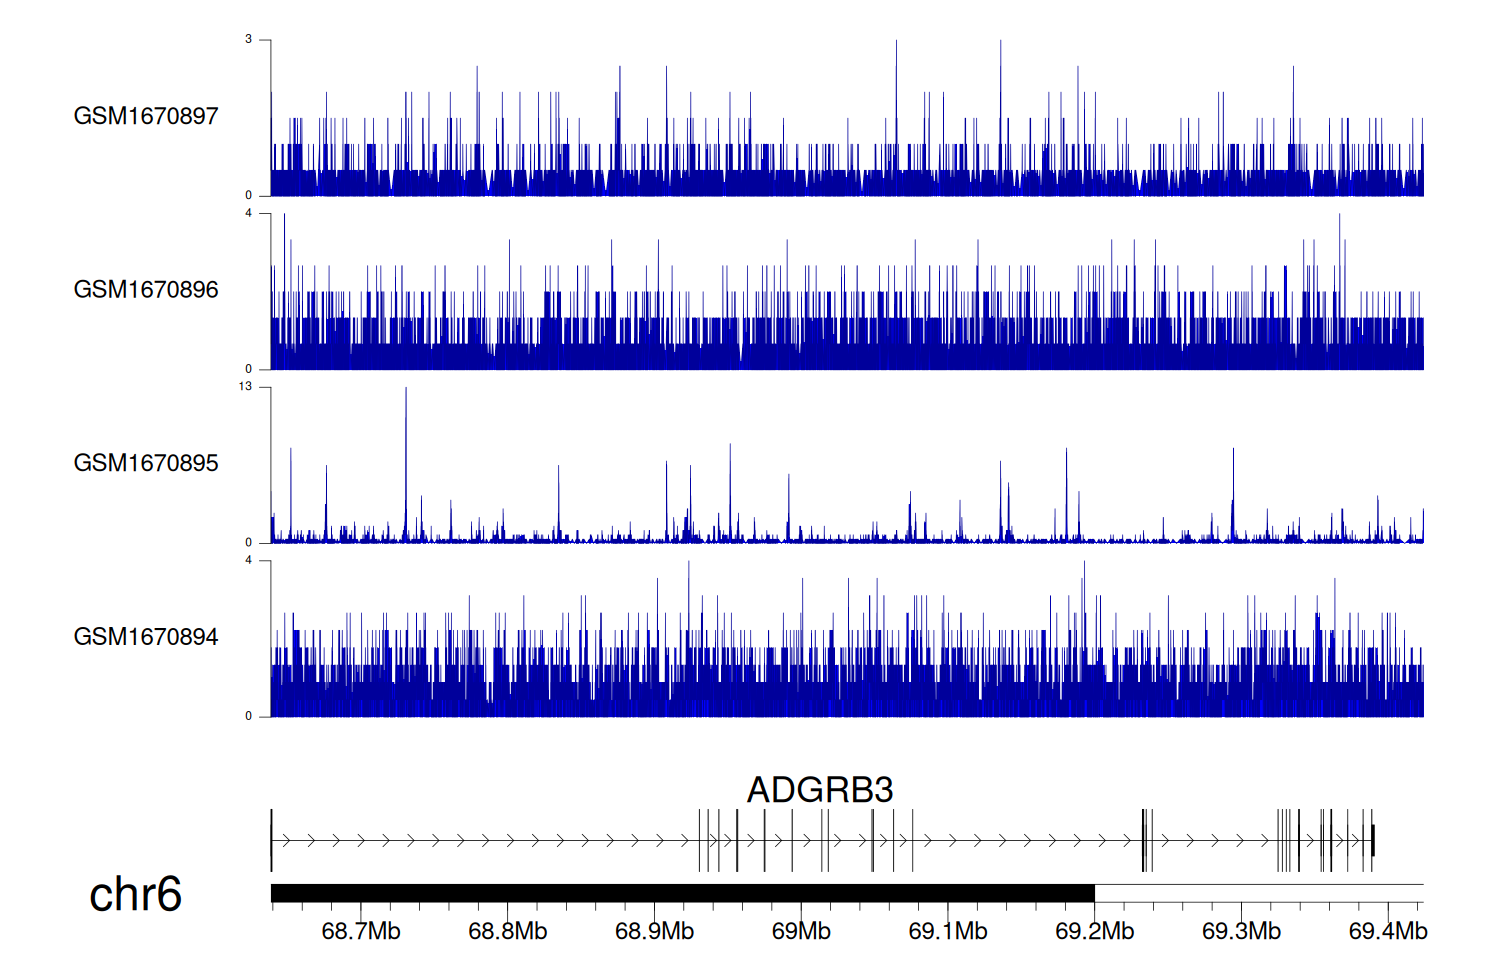
> Dataset: GSE35465 - ADGRB3 peak across samples
|
Peak Plot

|
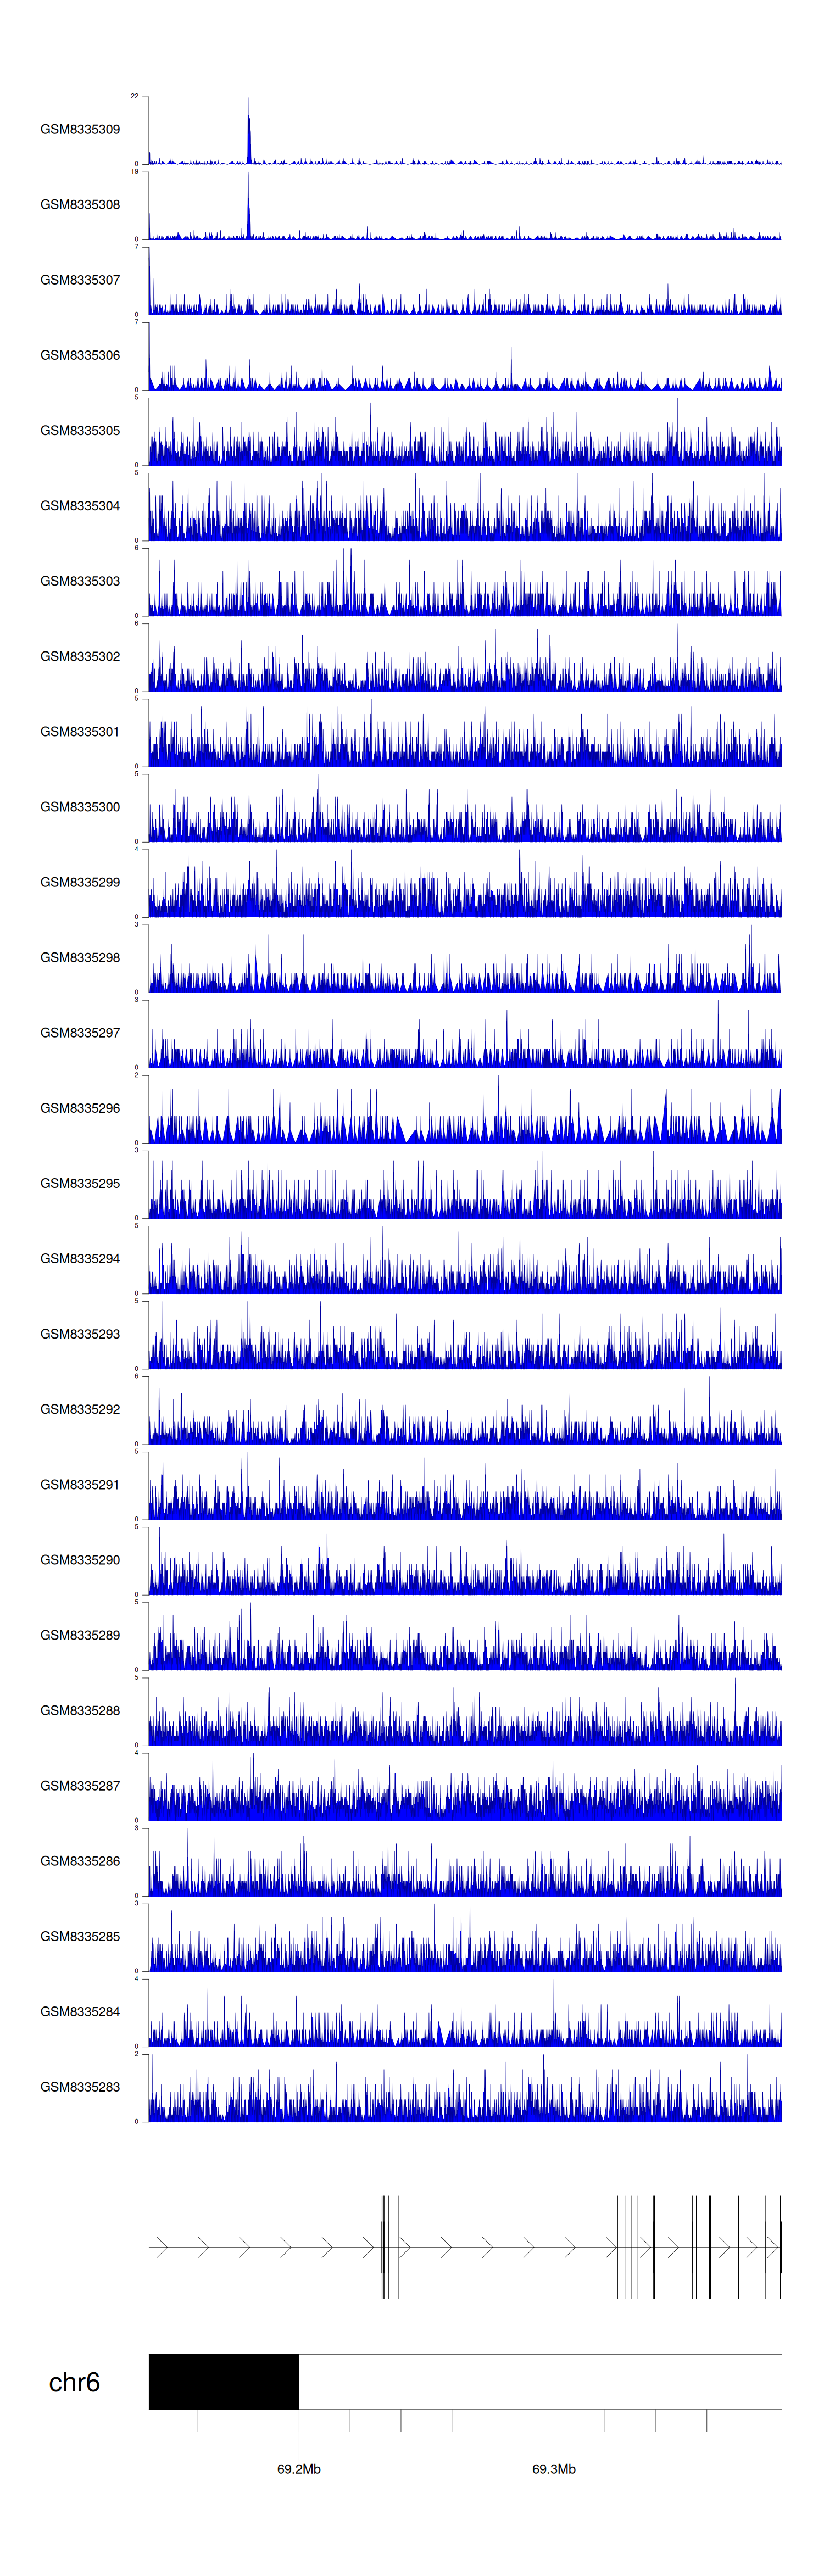
> Dataset: GSE68402 - ADGRB3 peak across samples
|
Peak Plot
|
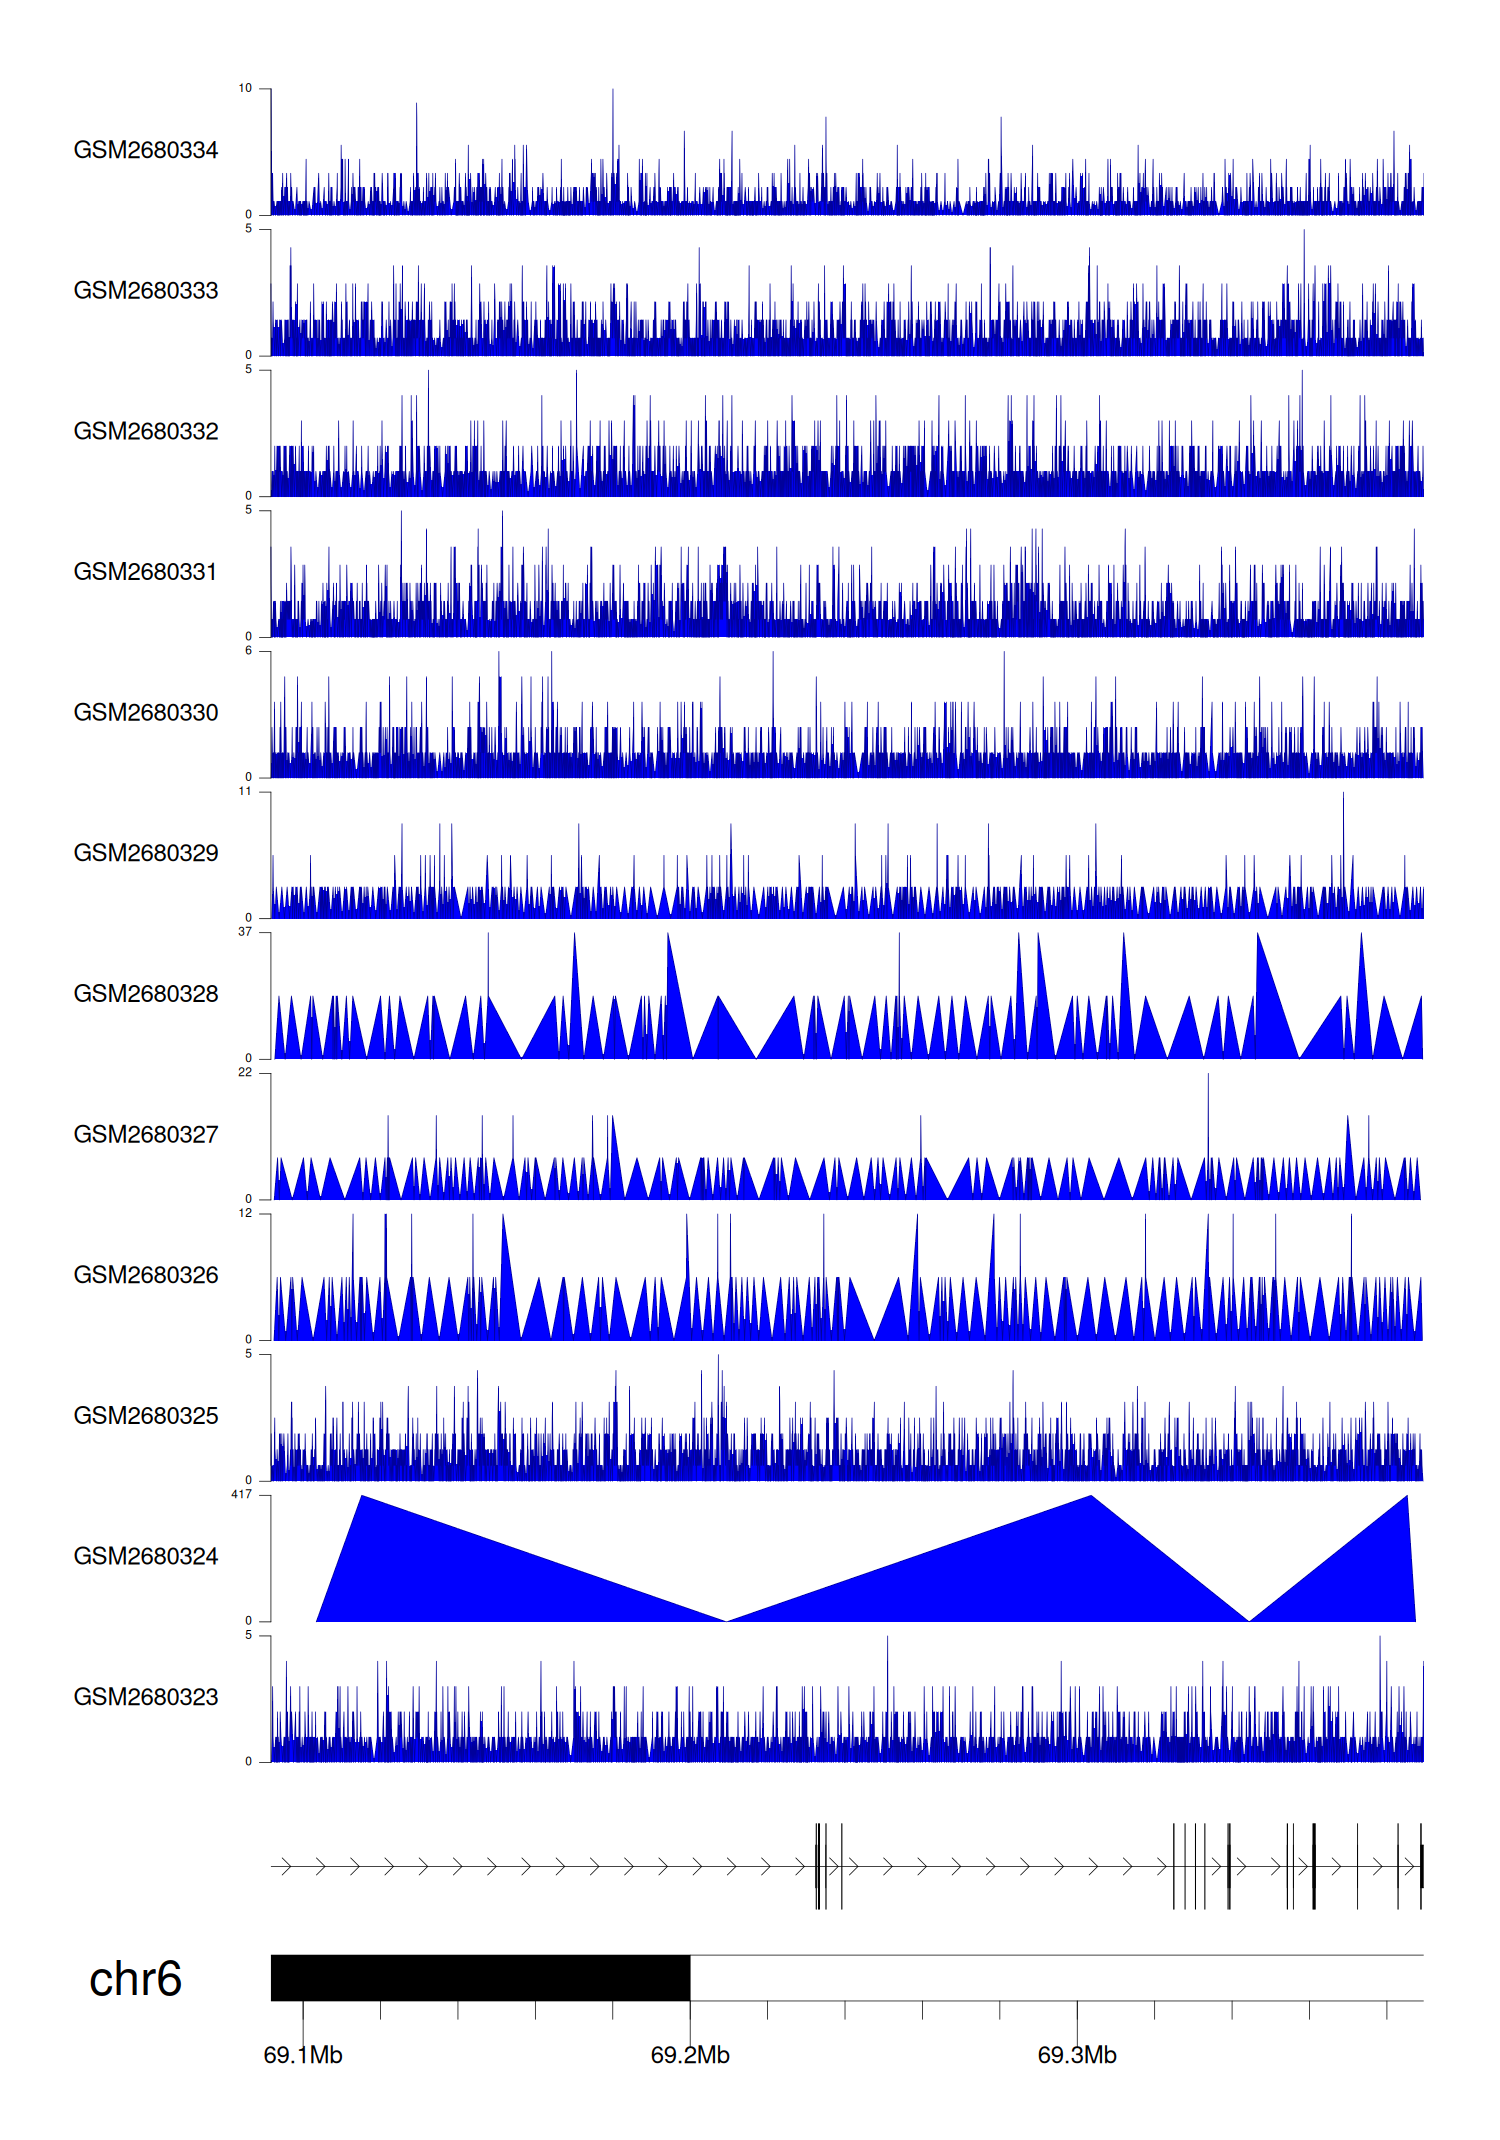
> Dataset: GSE270130 - ADGRB3 peak across samples
|
Peak Plot
|
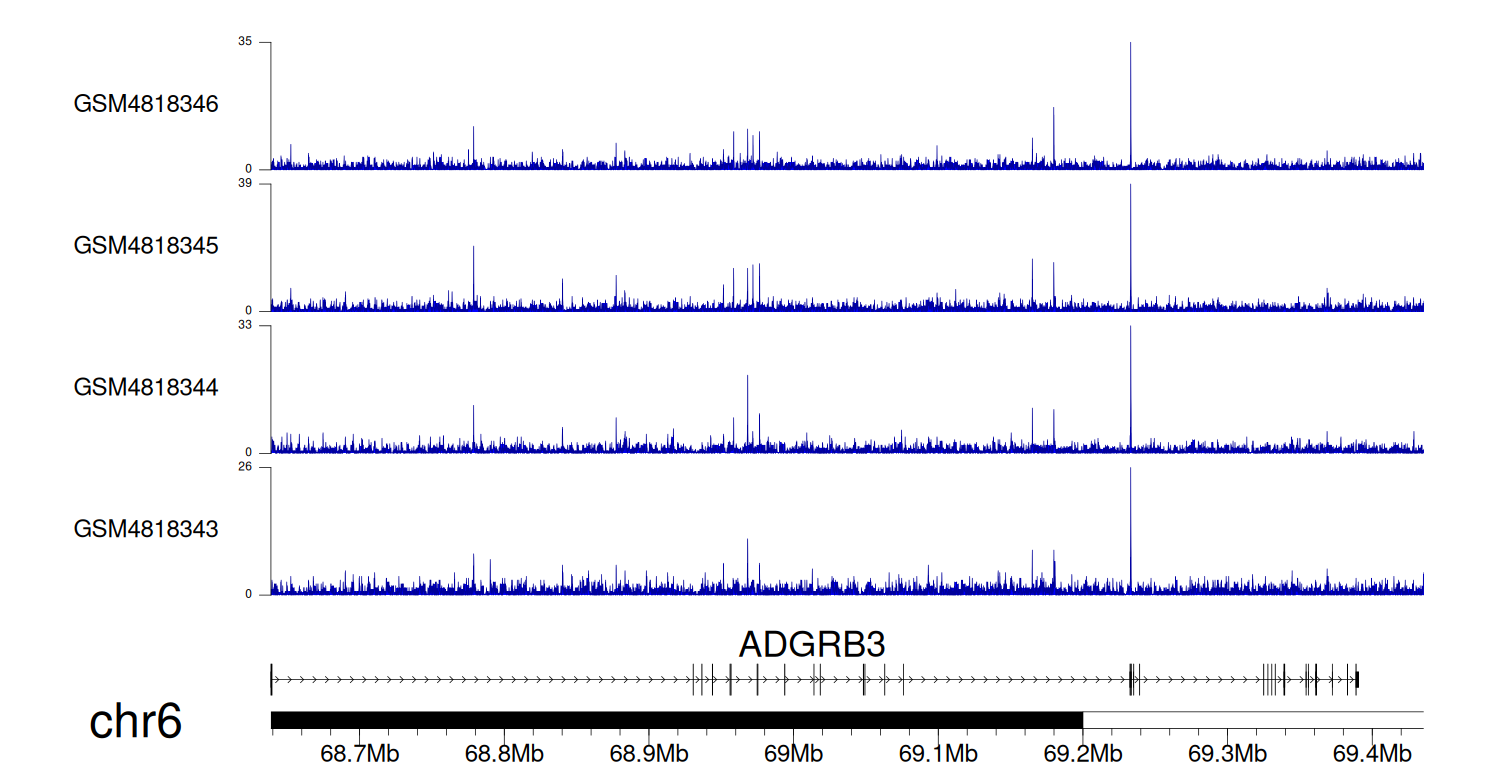
> Dataset: GSE100400 - ADGRB3 peak across samples
|
Peak Plot
|
> Dataset: GSE131257 - ADGRB3 peak across samples
|
Peak Plot
|
|
|
