Gene Information
|
Gene Name
|
AKT3 |
|
Gene ID
|
10000
|
|
Gene Full Name
|
AKT serine/threonine kinase 3 |
|
Gene Alias
|
MPPH|MPPH2|PKB-GAMMA|PKBG|PRKBG|RAC-PK-gamma|RAC-gamma|STK-2 |
|
Transcripts
|
ENSG00000117020
|
|
Virus
|
HBV |
|
Gene Type
|
protein-coding |
|
HPA Location Info
|
Nucleoplasm, Golgi apparatus, Cytosol;Plasma membrane, Primary cilium, Basal body; 
|
|
Membrane Info
|
Cancer-related genes, Disease related genes, Enzymes, Human disease related genes, Plasma proteins, Potential drug targets, Predicted intracellular proteins, RAS pathway related proteins |
|
Uniport_ID
|
Q9Y243
|
|
HGNC ID
|
HGNC:393
|
|
OMIM ID
|
611223 |
|
Summary
|
The protein encoded by this gene is a member of the AKT, also called PKB, serine/threonine protein kinase family. AKT kinases are known to be regulators of cell signaling in response to insulin and growth factors. They are involved in a wide variety of biological processes including cell proliferation, differentiation, apoptosis, tumorigenesis, as well as glycogen synthesis and glucose uptake. This kinase has been shown to be stimulated by platelet-derived growth factor (PDGF), insulin, and insulin-like growth factor 1 (IGF1). Alternatively splice transcript variants encoding distinct isoforms have been described. [provided by RefSeq, Jul 2008] |
Target gene [AKT3] related to virus gene/protein/region 
Mutation Table: if previous studies reported that target gene was related to virus gene/region/protein, the information in this literature was listed in this section
Target gene [AKT3] related to VISs
Integration Table: if previous studies reported that target gene was altered by virus integration events, the overlap between VISs in this literature and Cistrome factors was listed in this section
| DVID |
Chromosome |
HM |
TFBS |
CA |
Sum of Overlapped Records |
Detail |
| 1041785 |
chr1 |
50 |
21 |
38 |
109 |
View |
Target gene [AKT3] related to Omics data
| Data ID |
Experiment type |
Sample number |
Platform |
|
GSE236281
|
RNA-seq |
12 |
Illumina MiSeq (Homo sapiens) |
|
C GSE35465
|
Chip-seq;RNA-seq |
6 |
Illumina HiSeq 2000 (Homo sapiens) |
|
GSE199850
|
scRNA-seq |
1 |
HiSeq X Ten (Homo sapiens) |
|
C GSE68402
|
Chip-seq |
26 |
Illumina MiSeq (Homo sapiens);Illumina HiSeq 2500 (Homo sapiens) |
|
S GSE247322
|
scRNA-seq |
27 |
Illumina NovaSeq 6000 (Homo sapiens) |
|
TCGA_LIHC_HBV
|
DNA methylation sequencing;RNA-seq |
97 |
TCGA |
|
C GSE270130
|
Chip-seq |
27 |
Illumina NovaSeq 6000 (Homo sapiens) |
|
GSE224901
|
RNA-seq |
21 |
Illumina NovaSeq 6000 (Homo sapiens) |
|
E C GSE100400
|
Chip-seq;RNA-seq;4C_cccDNA |
31 |
Illumina NextSeq 500 (Homo sapiens);Illumina NextSeq 500 (Mus musculus) |
|
GSE173897
|
RNA-seq |
95 |
Illumina HiSeq 4000 (Homo sapiens) |
|
GSE262515
|
RNA-seq |
21 |
Illumina HiSeq 2500 (Homo sapiens);Illumina HiSeq 2500 (Mus musculus) |
|
GSE110345
|
RNA-seq |
4 |
Illumina HiSeq 2500 (Homo sapiens) |
|
C GSE131257
|
ATAC-seq;RNA-seq |
19 |
Illumina HiSeq 2500 (Homo sapiens) |
|
GSE94660
|
RNA-seq |
42 |
Illumina HiSeq 2500 (Homo sapiens) |
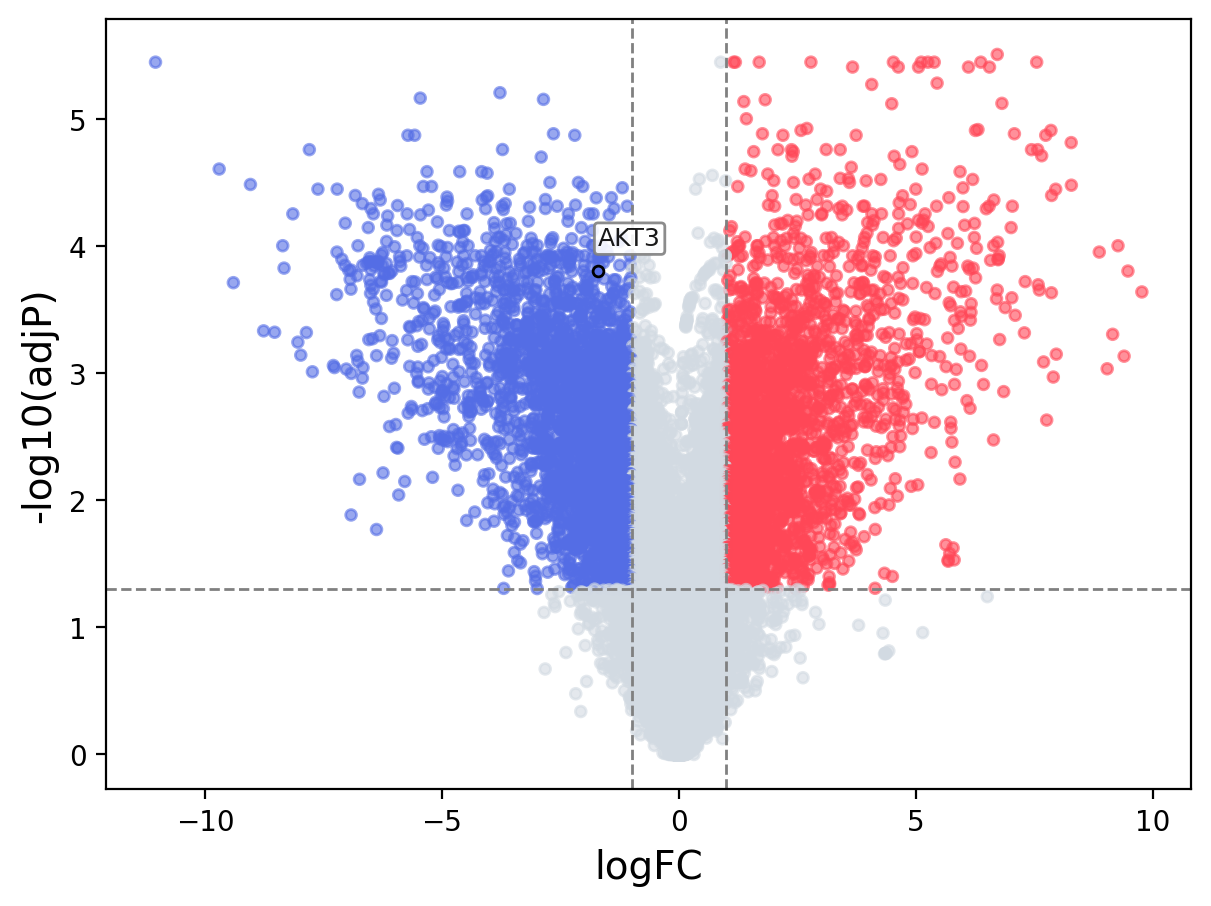
When the query gene is differentially changed in the dataset, a volcano/bar plot will be displayed.
> Dataset: GSE100400 - AKT3 expression across samples
|
Volcano Plot
|
Bar Plot
|
|
|
