Gene Information
|
Gene Name
|
ALDH1L1 |
|
Gene ID
|
10840
|
|
Gene Full Name
|
aldehyde dehydrogenase 1 family member L1 |
|
Gene Alias
|
10-FTHFDH|10-fTHF|FDH|FTHFD |
|
Transcripts
|
ENSG00000144908
|
|
Virus
|
HTLV1 |
|
Gene Type
|
protein-coding |
|
HPA Location Info
|
Cytosol; 
|
|
Membrane Info
|
Enzymes, Metabolic proteins, Plasma proteins, Predicted intracellular proteins |
|
Uniport_ID
|
O75891
|
|
HGNC ID
|
HGNC:3978
|
|
OMIM ID
|
600249 |
|
Summary
|
The protein encoded by this gene catalyzes the conversion of 10-formyltetrahydrofolate, nicotinamide adenine dinucleotide phosphate (NADP+), and water to tetrahydrofolate, NADPH, and carbon dioxide. The encoded protein belongs to the aldehyde dehydrogenase family. Loss of function or expression of this gene is associated with decreased apoptosis, increased cell motility, and cancer progression. There is an antisense transcript that overlaps on the opposite strand with this gene locus. Alternative splicing results in multiple transcript variants. [provided by RefSeq, Jun 2012] |
Target gene [ALDH1L1] related to VISs 
Integration Table: if previous studies reported that target gene was altered by virus integration events, the overlap between VISs in this literature and Cistrome factors was listed in this section
| DVID |
Chromosome |
HM |
TFBS |
CA |
Sum of Overlapped Records |
Detail |
| 6014302 |
chr3 |
17 |
0 |
0 |
17 |
View |
Target gene [ALDH1L1] related to Omics data
| Data ID |
Experiment type |
Sample number |
Platform |
|
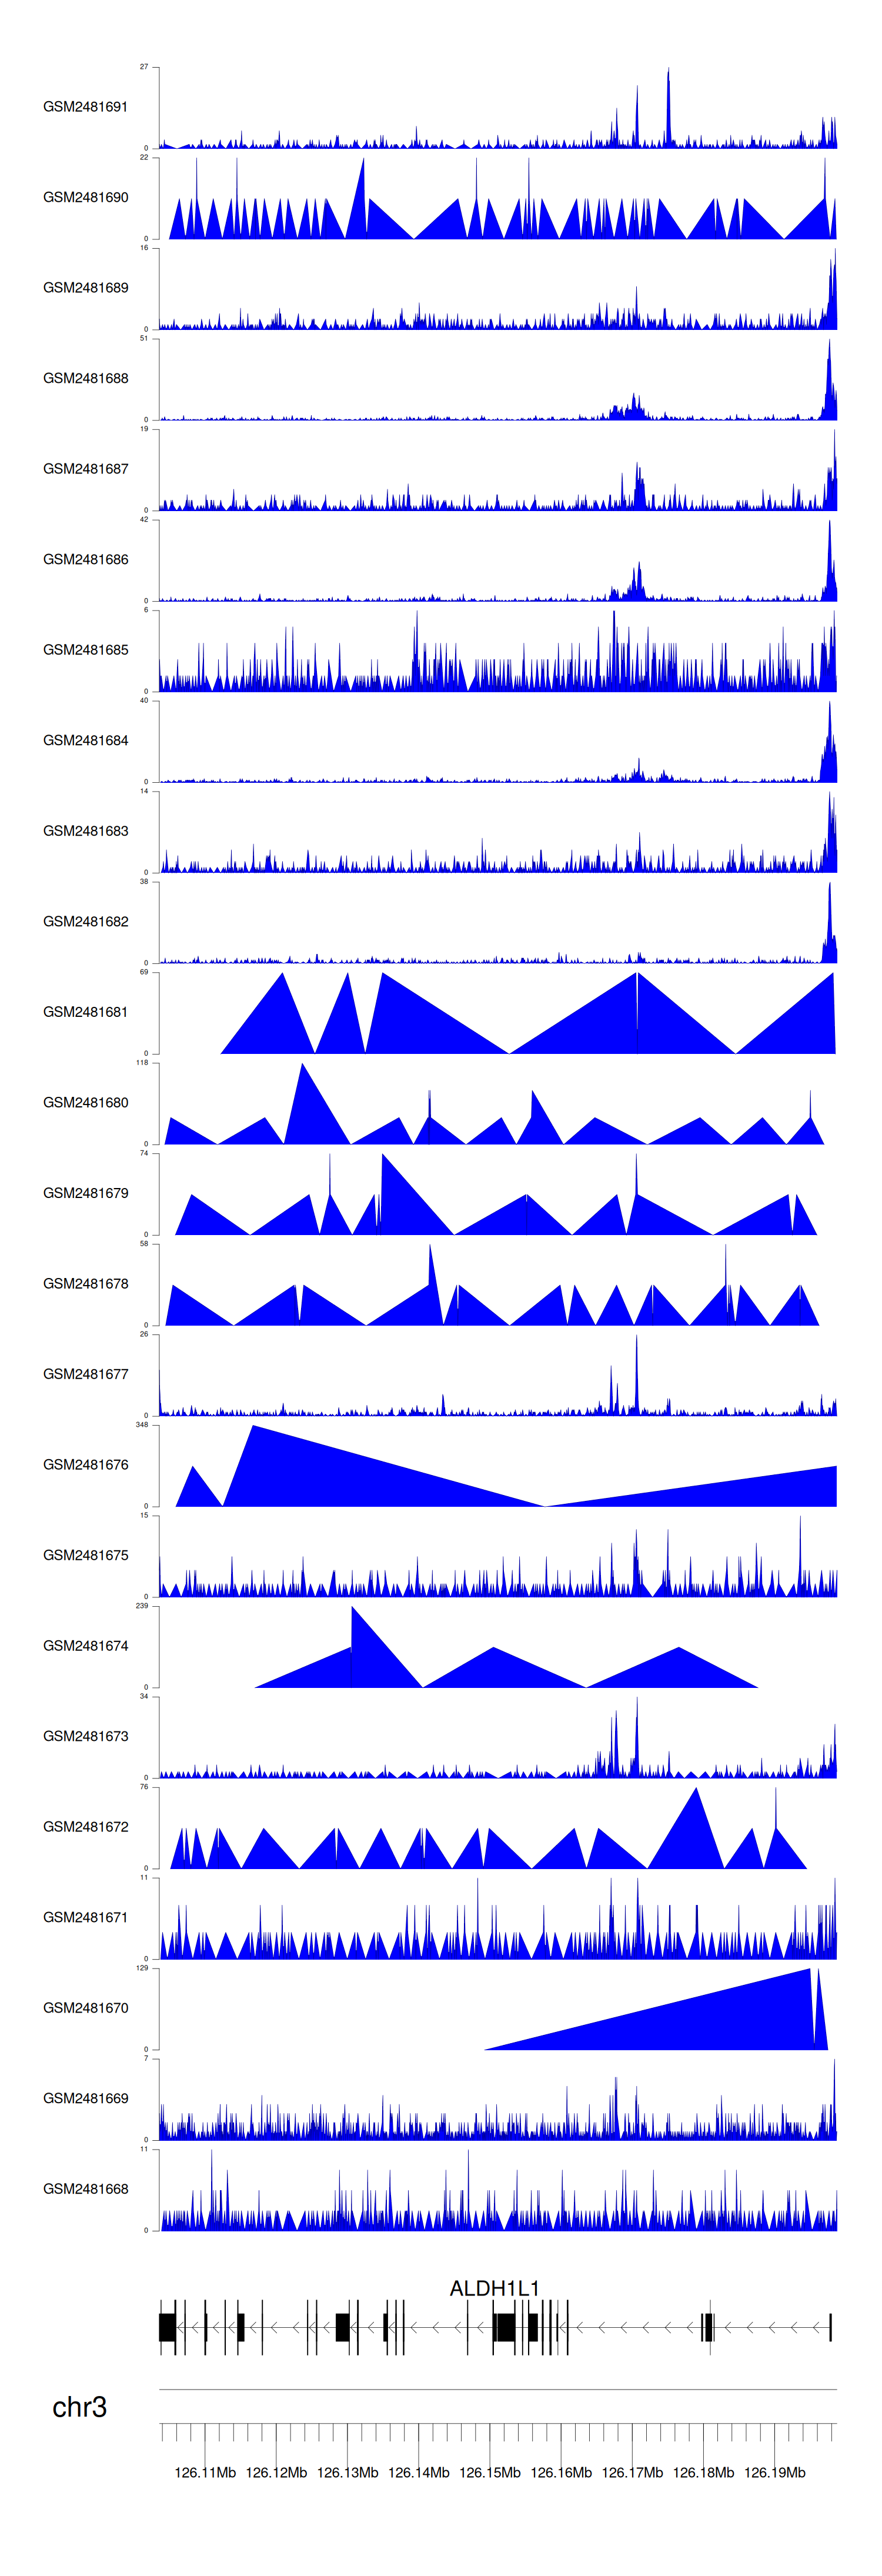
C GSE94732
|
Chip-seq |
24 |
Illumina NextSeq 500 (Homo sapiens);illumina Genome Analyzer IIx (Homo sapiens) |
|
GSE168557
|
Expression array |
6 |
Agilent-039494 SurePrint G3 Human GE v2 8x60K Microarray 039381 (Feature Number version) |
|
GSE52244
|
Expression array |
15 |
[HuEx-1_0-st] Affymetrix Human Exon 1.0 ST Array [probe set (exon) version] |
|
GSE10789
|
Expression array |
6 |
NCI/ATC Hs-OperonV3 |
|
GSE189602
|
Methylation profiling (Array) |
4 |
Infinium MethylationEPIC |
|
GSE136189
|
Methylation profiling (Array) |
40 |
Illumina HumanMethylation450 BeadChip (HumanMethylation450_15017482);Illumina Infinium HumanMethylation850 BeadChip |
When the gene can detect a peak in the dataset, a peak plot will be displayed.
> Dataset: GSE94732 - ALDH1L1 peak across samples
|
Peak Plot
|
|
|
