Gene Information
|
Gene Name
|
AP1G1 |
|
Gene ID
|
164
|
|
Gene Full Name
|
adaptor related protein complex 1 subunit gamma 1 |
|
Gene Alias
|
ADTG|CLAPG1|USRISD |
|
Transcripts
|
ENSG00000166747
|
|
Virus
|
HBV |
|
Gene Type
|
protein-coding |
|
HPA Location Info
|
Golgi apparatus, Vesicles;Cytosol; 
|
|
Membrane Info
|
Disease related genes, Metabolic proteins, Potential drug targets, Predicted intracellular proteins, Transporters |
|
Uniport_ID
|
O43747
|
|
HGNC ID
|
HGNC:555
|
|
OMIM ID
|
603533 |
|
Summary
|
Adaptins are important components of clathrin-coated vesicles transporting ligand-receptor complexes from the plasma membrane or from the trans-Golgi network to lysosomes. The adaptin family of proteins is composed of four classes of molecules named alpha, beta-, beta prime- and gamma- adaptins. Adaptins, together with medium and small subunits, form a heterotetrameric complex called an adaptor, whose role is to promote the formation of clathrin-coated pits and vesicles. The protein encoded by this gene is a gamma-adaptin protein and it belongs to the adaptor complexes large subunits family. Two transcript variants encoding different isoforms have been found for this gene. [provided by RefSeq, Jul 2008] |
Target gene [AP1G1] related to VISs 
Integration Table: if previous studies reported that target gene was altered by virus integration events, the overlap between VISs in this literature and Cistrome factors was listed in this section
| DVID |
Chromosome |
HM |
TFBS |
CA |
Sum of Overlapped Records |
Detail |
| 1013824 |
chr16 |
0 |
0 |
4 |
4 |
View |
| 1015388 |
chr16 |
0 |
0 |
2 |
2 |
View |
Target gene [AP1G1] related to Omics data
| Data ID |
Experiment type |
Sample number |
Platform |
|
GSE236281
|
RNA-seq |
12 |
Illumina MiSeq (Homo sapiens) |
|
C GSE35465
|
Chip-seq;RNA-seq |
6 |
Illumina HiSeq 2000 (Homo sapiens) |
|
C GSE68402
|
Chip-seq |
26 |
Illumina MiSeq (Homo sapiens);Illumina HiSeq 2500 (Homo sapiens) |
|
GSE247322
|
scRNA-seq |
27 |
Illumina NovaSeq 6000 (Homo sapiens) |
|
TCGA_LIHC_HBV
|
DNA methylation sequencing;RNA-seq |
97 |
TCGA |
|
C GSE270130
|
Chip-seq |
27 |
Illumina NovaSeq 6000 (Homo sapiens) |
|
GSE224901
|
RNA-seq |
21 |
Illumina NovaSeq 6000 (Homo sapiens) |
|
GSE100400
|
Chip-seq;RNA-seq;4C_cccDNA |
31 |
Illumina NextSeq 500 (Homo sapiens);Illumina NextSeq 500 (Mus musculus) |
|
GSE173897
|
RNA-seq |
95 |
Illumina HiSeq 4000 (Homo sapiens) |
|
GSE262515
|
RNA-seq |
21 |
Illumina HiSeq 2500 (Homo sapiens);Illumina HiSeq 2500 (Mus musculus) |
|
GSE110345
|
RNA-seq |
4 |
Illumina HiSeq 2500 (Homo sapiens) |
|
C GSE131257
|
ATAC-seq;RNA-seq |
19 |
Illumina HiSeq 2500 (Homo sapiens) |
|
GSE94660
|
RNA-seq |
42 |
Illumina HiSeq 2500 (Homo sapiens) |
When the gene can detect a peak in the dataset, a peak plot will be displayed.
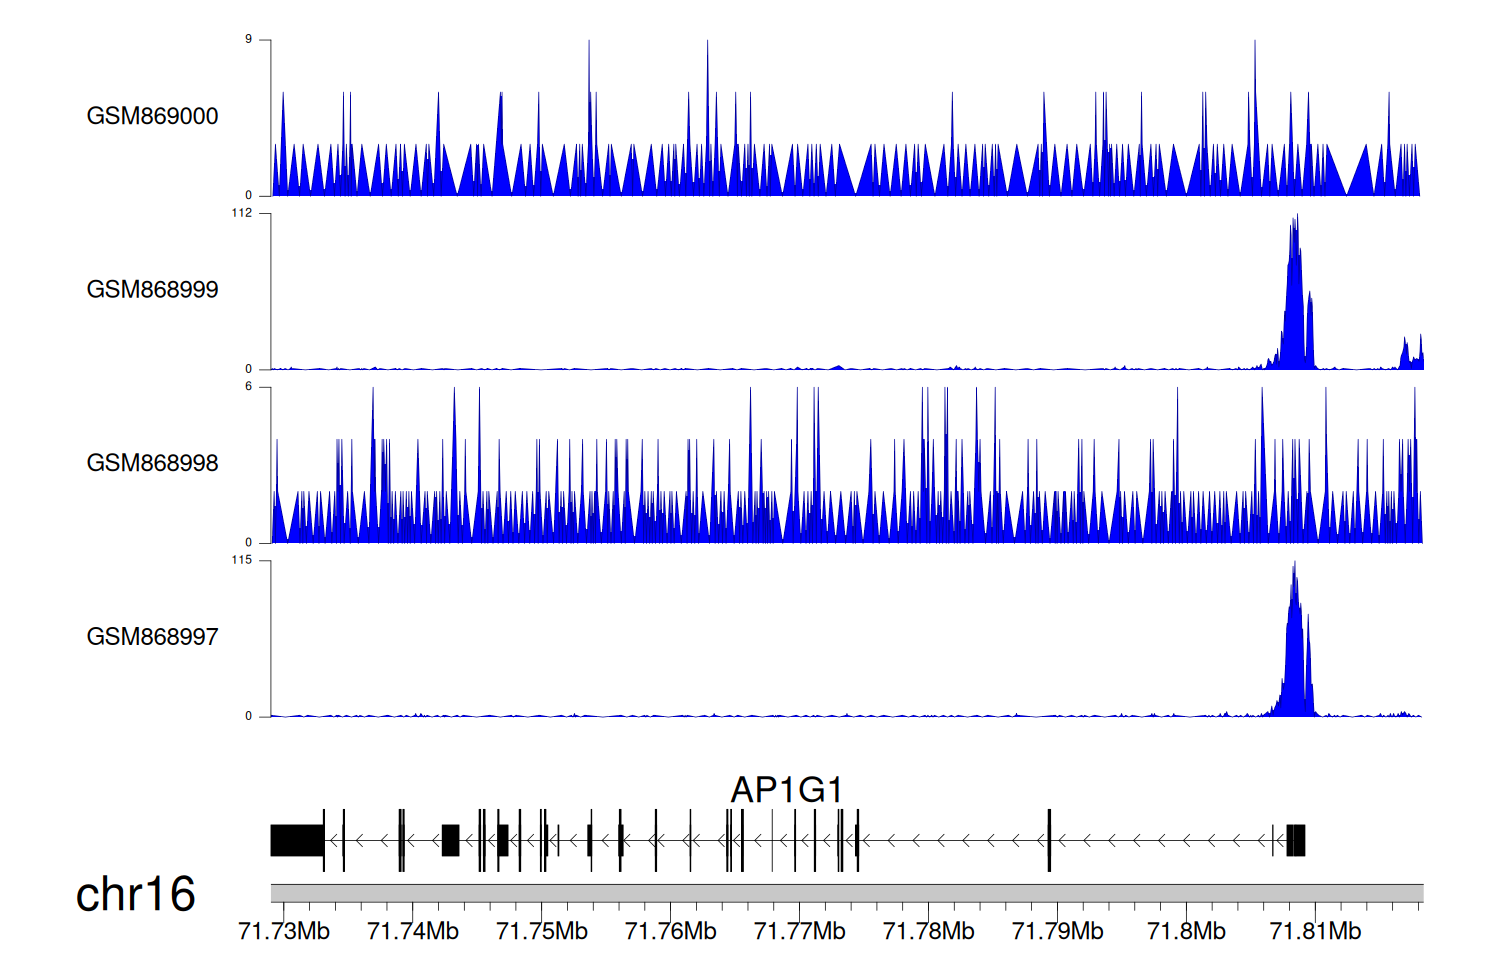
> Dataset: GSE35465 - AP1G1 peak across samples
|
Peak Plot
|
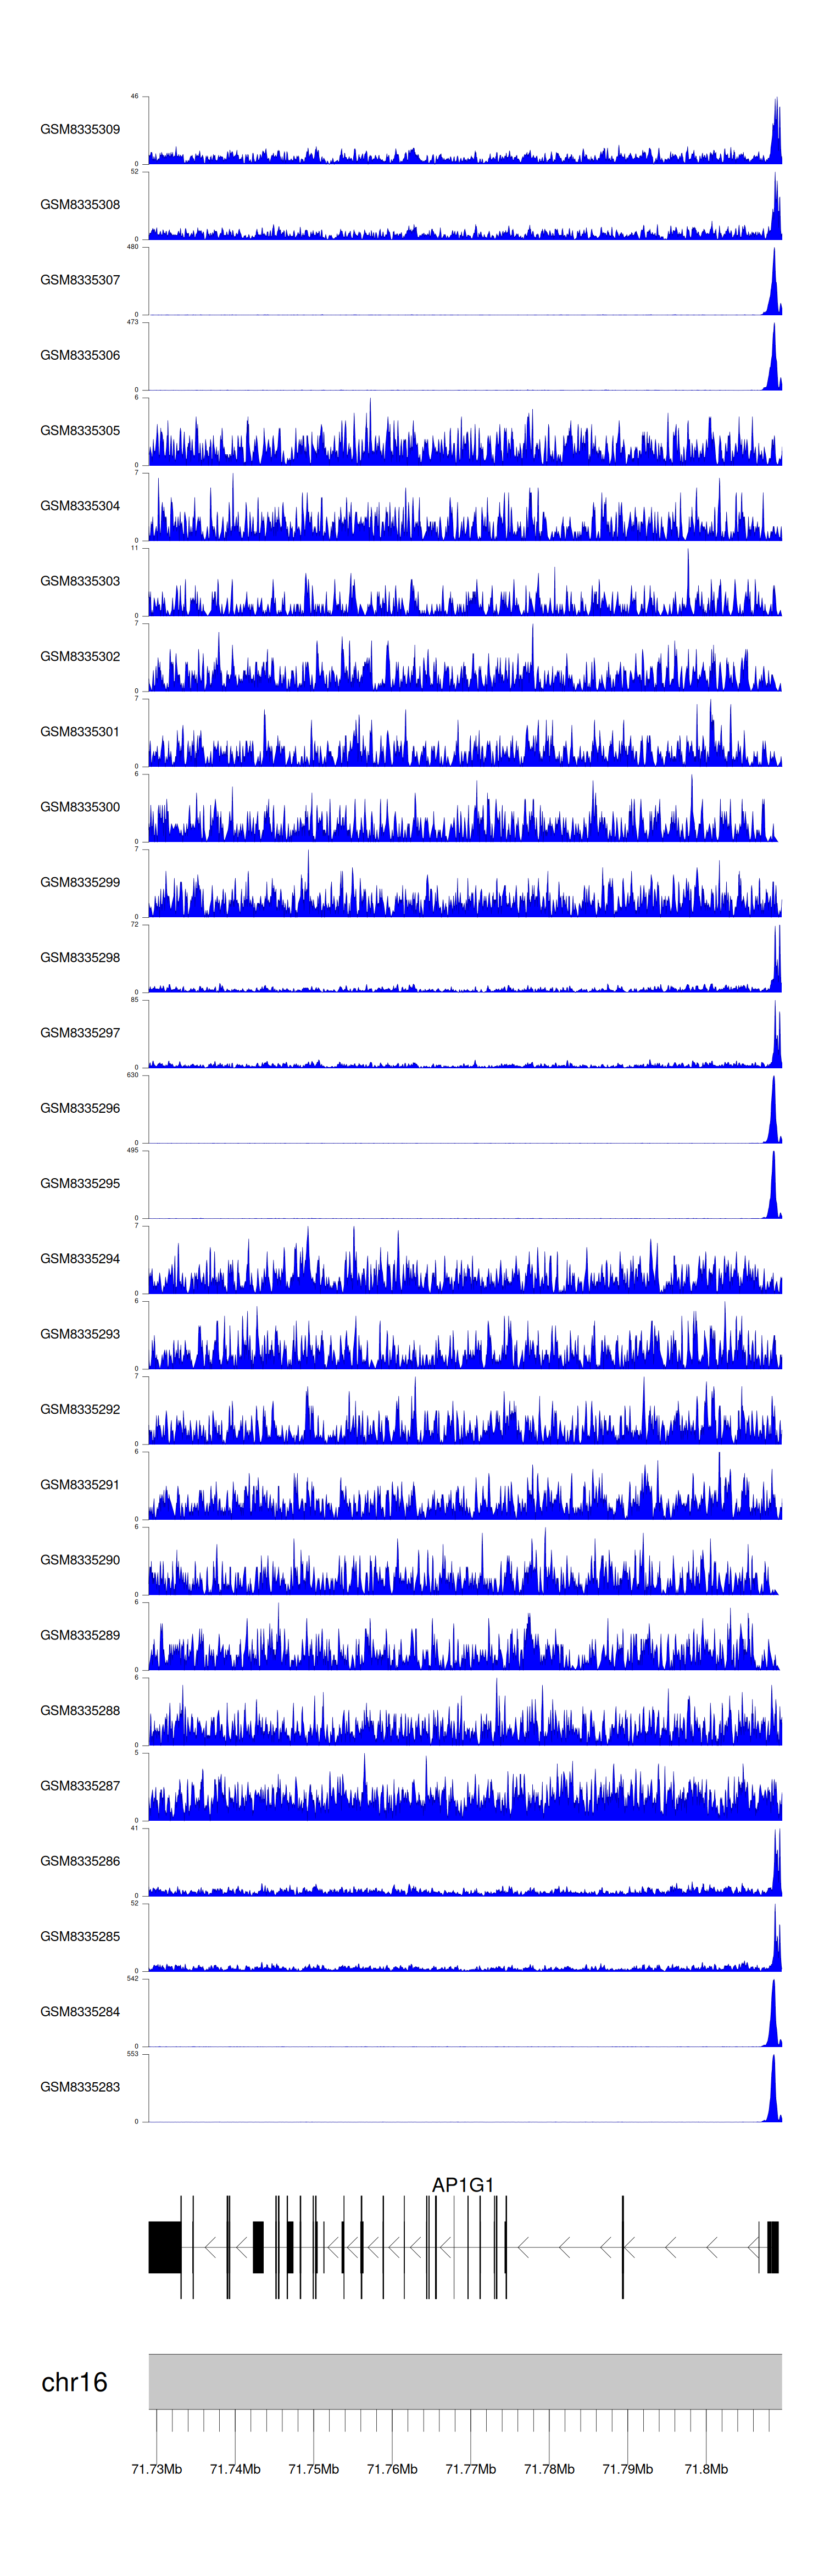
> Dataset: GSE68402 - AP1G1 peak across samples
|
Peak Plot
|
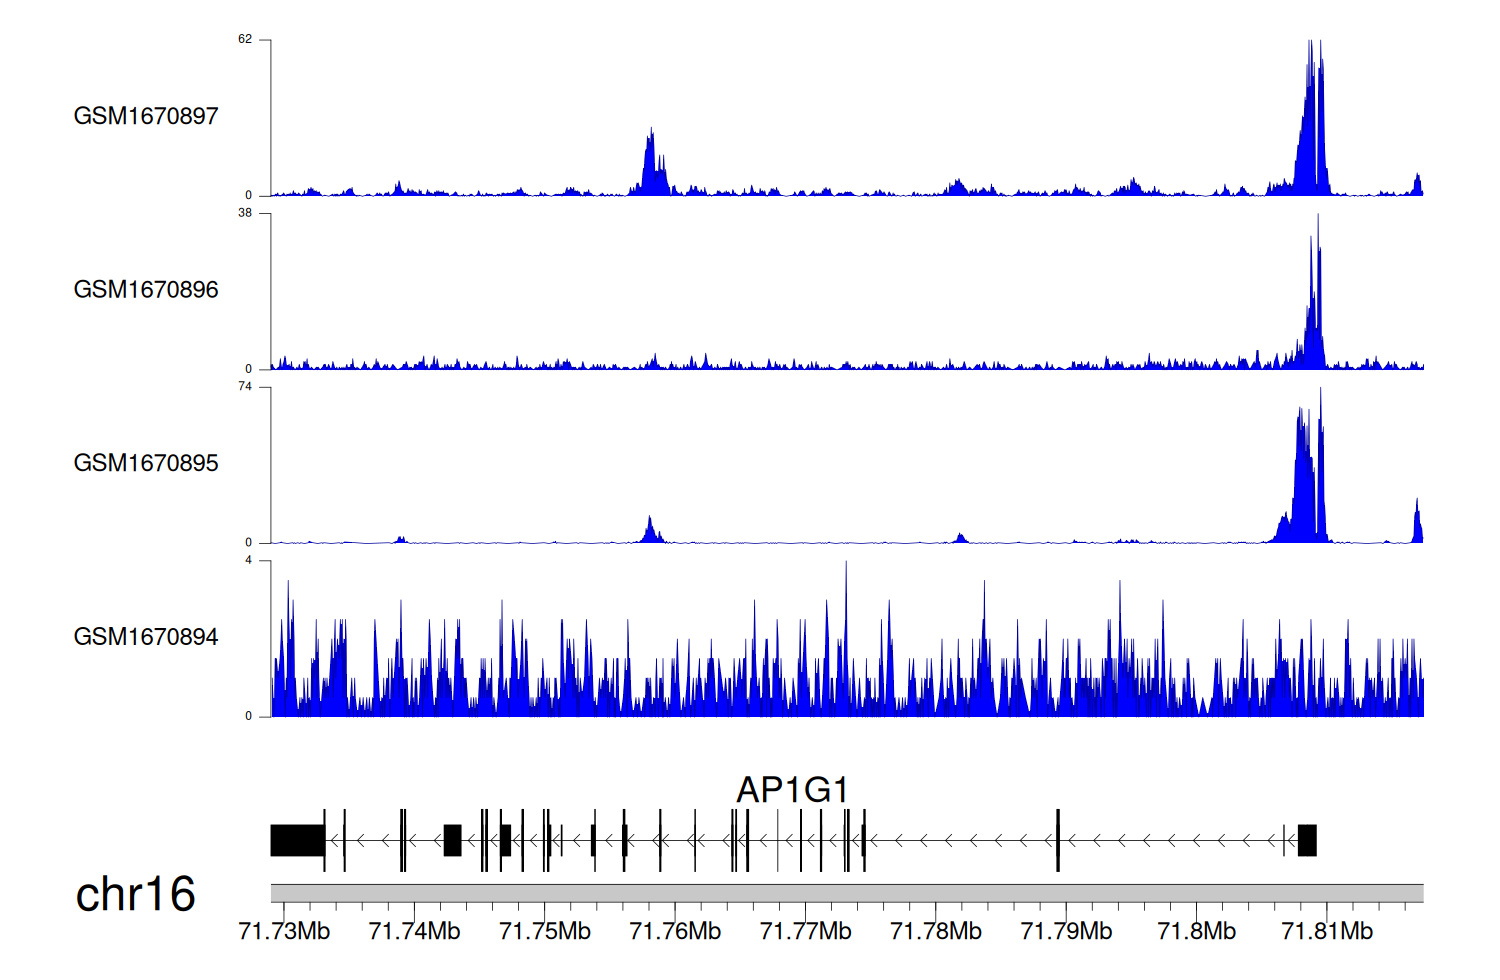
> Dataset: GSE270130 - AP1G1 peak across samples
|
Peak Plot
|
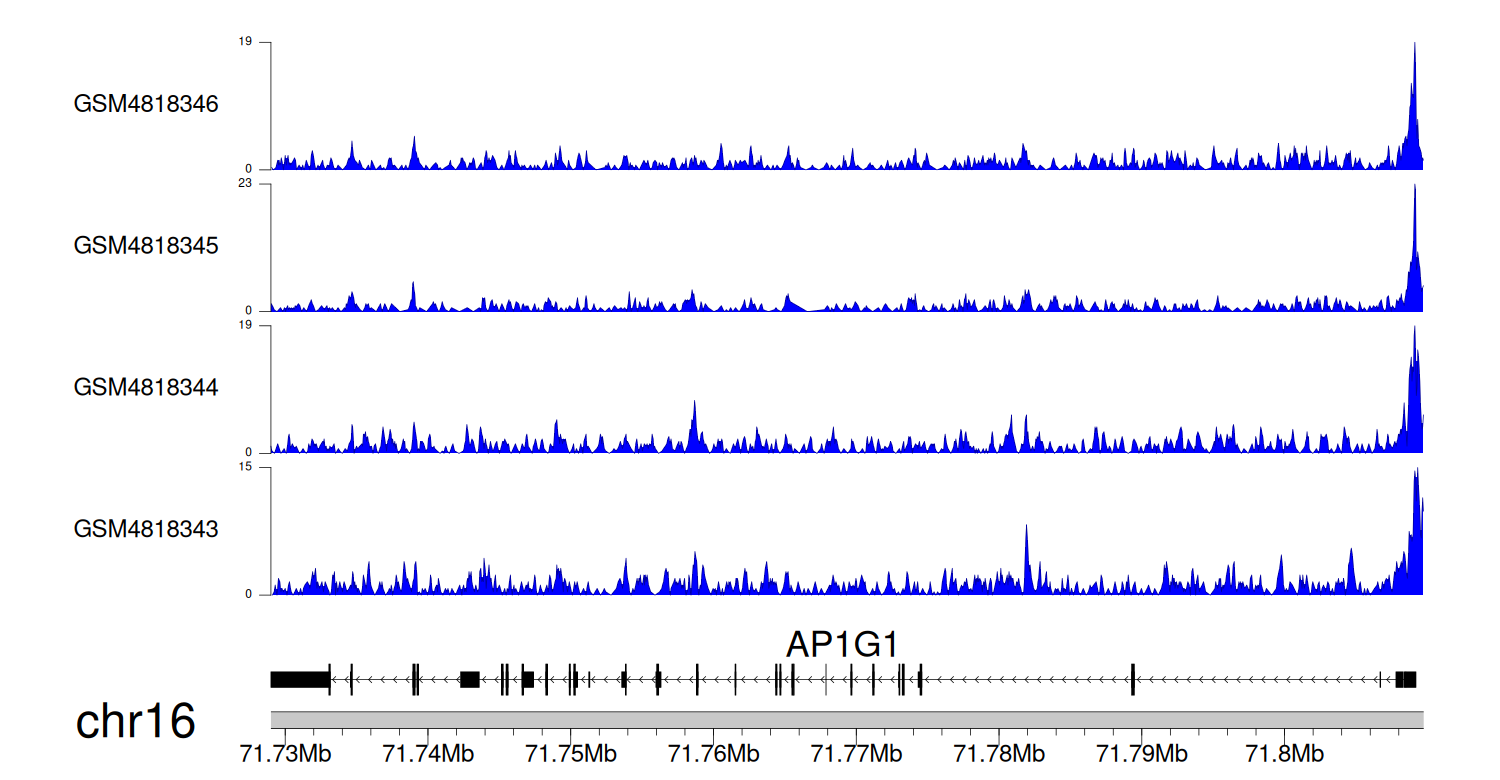
> Dataset: GSE131257 - AP1G1 peak across samples
|
Peak Plot
|
|
|
