Gene Information
|
Gene Name
|
ATOH8 |
|
Gene ID
|
84913
|
|
Gene Full Name
|
atonal bHLH transcription factor 8 |
|
Gene Alias
|
HATH6|bHLHa21 |
|
Transcripts
|
ENSG00000168874
|
|
Virus
|
HTLV1 |
|
Gene Type
|
protein-coding |
|
HPA Location Info
|
Nucleoplasm; 
|
|
Membrane Info
|
Predicted intracellular proteins, Transcription factors |
|
Uniport_ID
|
Q96SQ7
|
|
HGNC ID
|
HGNC:24126
|
|
OMIM ID
|
619820 |
|
Summary
|
Enables DNA-binding transcription factor activity and E-box binding activity. Involved in several processes, including positive regulation of SMAD protein signal transduction; positive regulation of endothelial cell differentiation; and regulation of gene expression. Located in nucleoplasm. [provided by Alliance of Genome Resources, Apr 2025] |
Target gene [ATOH8] related to VISs 
Integration Table: if previous studies reported that target gene was altered by virus integration events, the overlap between VISs in this literature and Cistrome factors was listed in this section
Target gene [ATOH8] related to Omics data
| Data ID |
Experiment type |
Sample number |
Platform |
|
C GSE94732
|
Chip-seq |
24 |
Illumina NextSeq 500 (Homo sapiens);illumina Genome Analyzer IIx (Homo sapiens) |
|
GSE168557
|
Expression array |
6 |
Agilent-039494 SurePrint G3 Human GE v2 8x60K Microarray 039381 (Feature Number version) |
|
GSE52244
|
Expression array |
15 |
[HuEx-1_0-st] Affymetrix Human Exon 1.0 ST Array [probe set (exon) version] |
|
GSE10789
|
Expression array |
6 |
NCI/ATC Hs-OperonV3 |
|
GSE189602
|
Methylation profiling (Array) |
4 |
Infinium MethylationEPIC |
|
GSE136189
|
Methylation profiling (Array) |
40 |
Illumina HumanMethylation450 BeadChip (HumanMethylation450_15017482);Illumina Infinium HumanMethylation850 BeadChip |
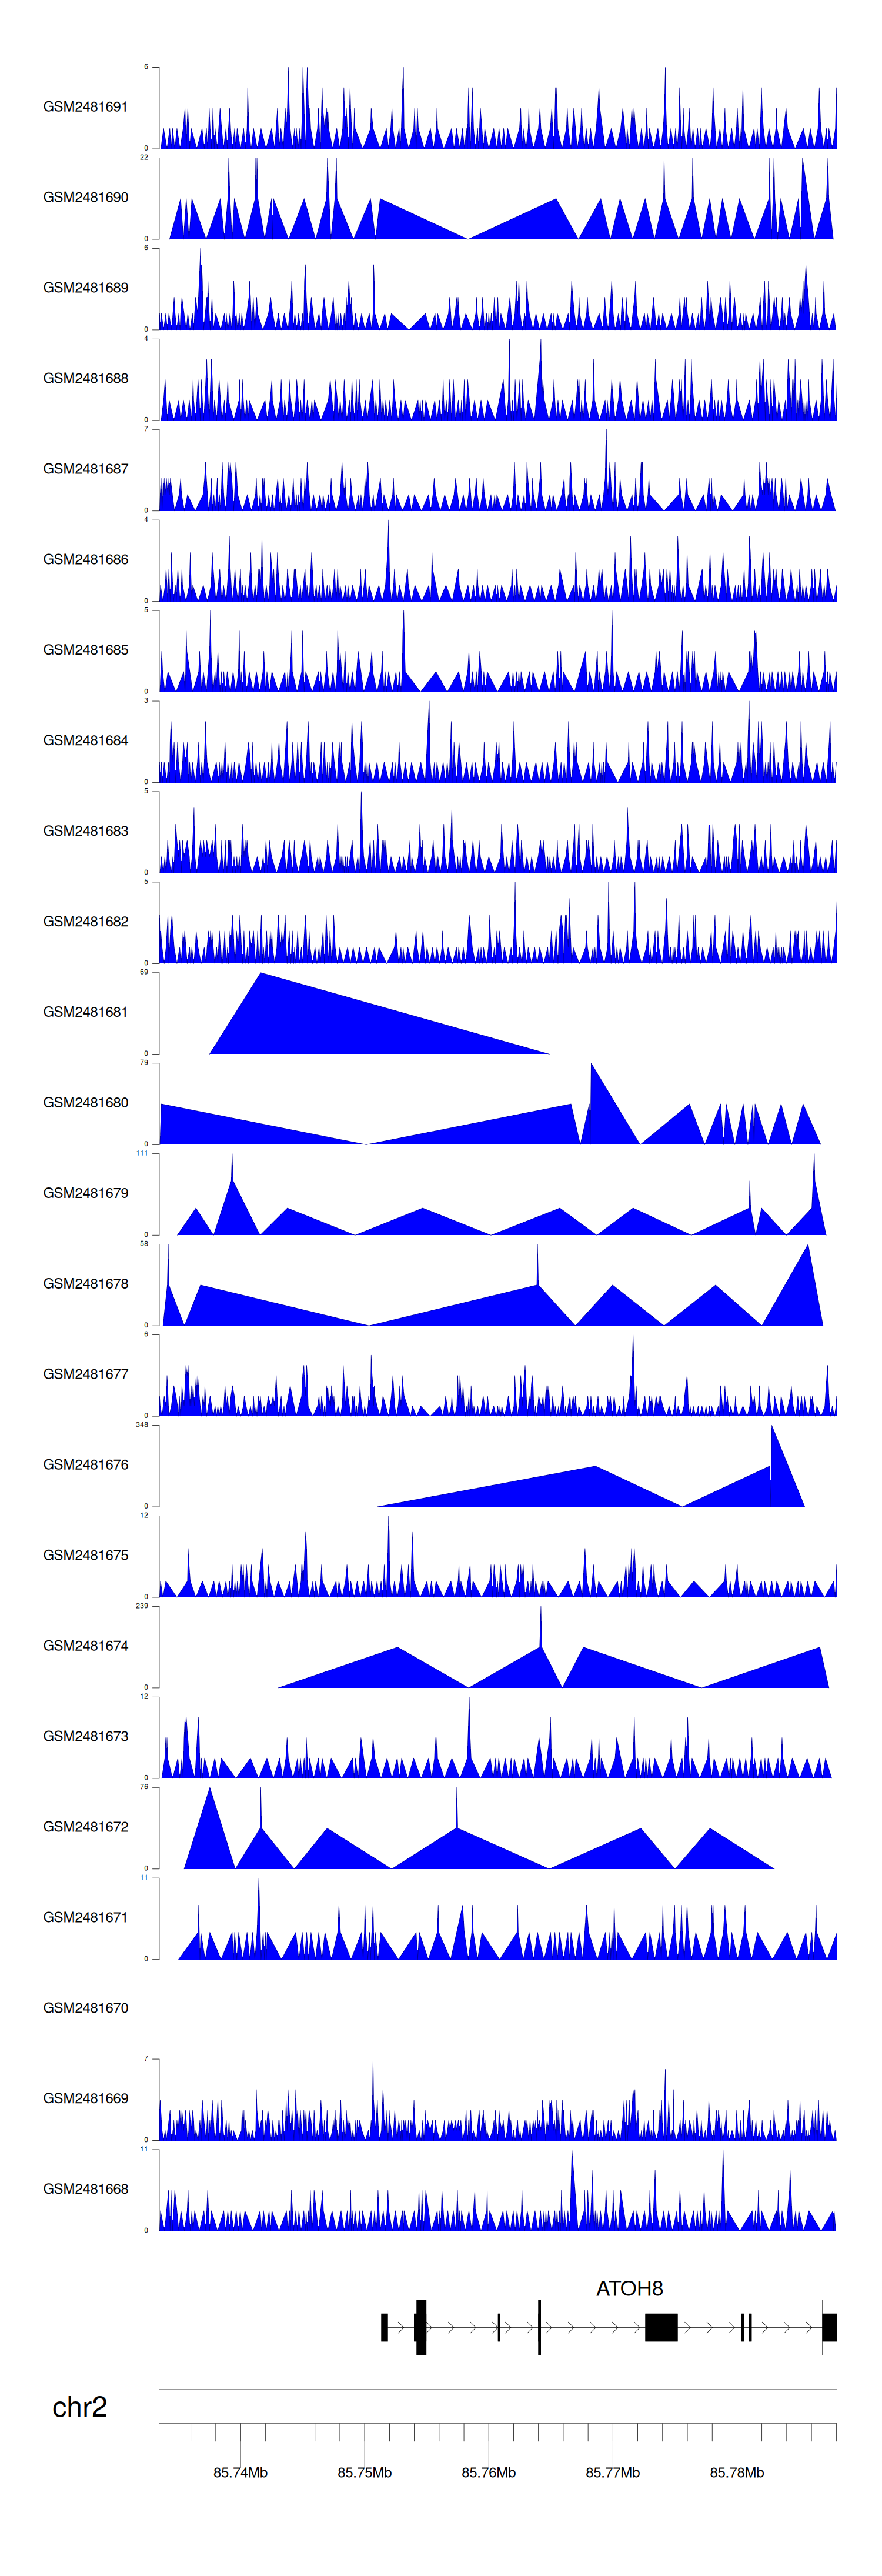
When the gene can detect a peak in the dataset, a peak plot will be displayed.
> Dataset: GSE94732 - ATOH8 peak across samples
|
Peak Plot
|
|
|
