Gene Information
|
Gene Name
|
ATP5ME |
|
Gene ID
|
521
|
|
Gene Full Name
|
ATP synthase membrane subunit e |
|
Gene Alias
|
ATP5I|ATP5K |
|
Transcripts
|
ENSG00000169020
|
|
Virus
|
HBV |
|
Gene Type
|
protein-coding |
|
HPA Location Info
|
Mitochondria; 
|
|
Membrane Info
|
Metabolic proteins, Predicted intracellular proteins, Transporters |
|
Uniport_ID
|
P56385
|
|
HGNC ID
|
HGNC:846
|
|
OMIM ID
|
601519 |
|
Summary
|
Mitochondrial ATP synthase catalyzes ATP synthesis, utilizing an electrochemical gradient of protons across the inner membrane during oxidative phosphorylation. It is composed of two linked multi-subunit complexes: the soluble catalytic core, F1, and the membrane-spanning component, Fo, which comprises the proton channel. The F1 complex consists of 5 different subunits (alpha, beta, gamma, delta, and epsilon) assembled in a ratio of 3 alpha, 3 beta, and a single representative of the other 3. The Fo seems to have nine subunits (a, b, c, d, e, f, g, F6 and 8). This gene encodes the e subunit of the Fo complex. Alternative splicing results in multiple transcript variants.[provided by RefSeq, Jun 2010] |
Target gene [ATP5ME] related to VISs 
Integration Table: if previous studies reported that target gene was altered by virus integration events, the overlap between VISs in this literature and Cistrome factors was listed in this section
| DVID |
Chromosome |
HM |
TFBS |
CA |
Sum of Overlapped Records |
Detail |
| 1002919 |
chr4 |
188 |
2 |
0 |
190 |
View |
Target gene [ATP5ME] related to Omics data
| Data ID |
Experiment type |
Sample number |
Platform |
|
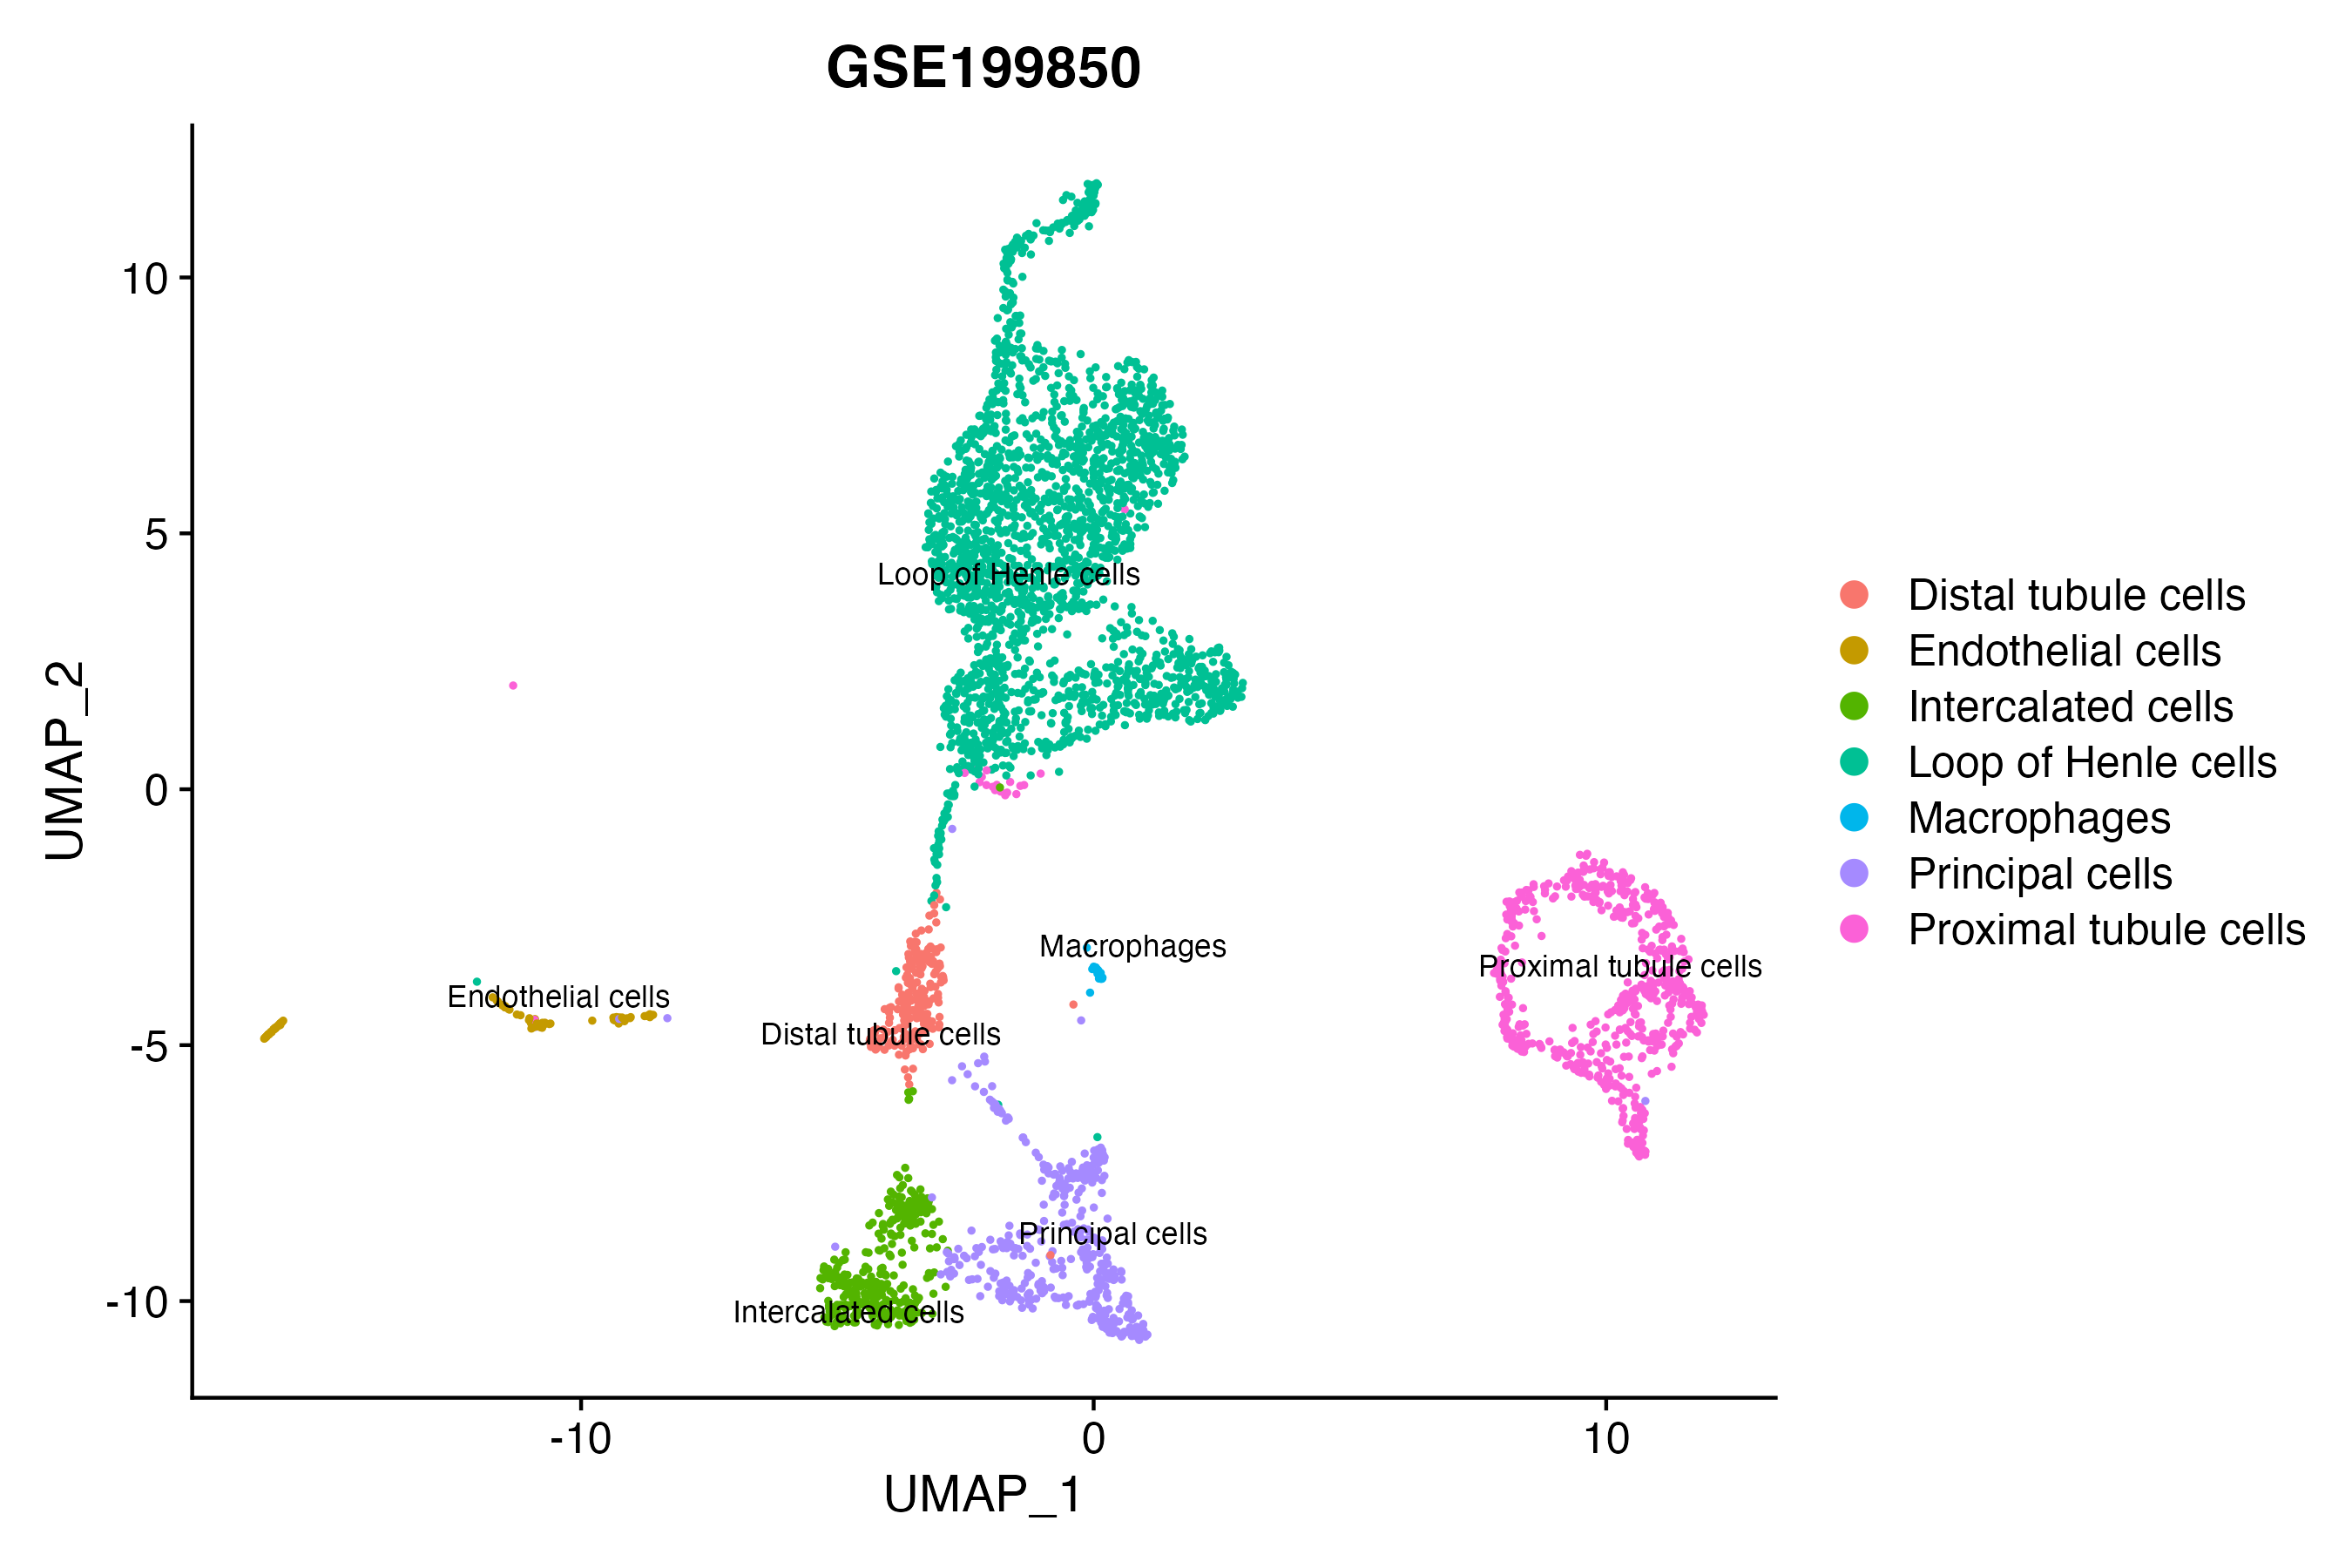
S GSE199850
|
scRNA-seq |
1 |
HiSeq X Ten (Homo sapiens) |
|
GSE247322
|
scRNA-seq |
27 |
Illumina NovaSeq 6000 (Homo sapiens) |
|
TCGA_LIHC_HBV
|
DNA methylation sequencing;RNA-seq |
97 |
TCGA |
|
C GSE270130
|
Chip-seq |
27 |
Illumina NovaSeq 6000 (Homo sapiens) |
|
GSE224901
|
RNA-seq |
21 |
Illumina NovaSeq 6000 (Homo sapiens) |
|
GSE100400
|
Chip-seq;RNA-seq;4C_cccDNA |
31 |
Illumina NextSeq 500 (Homo sapiens);Illumina NextSeq 500 (Mus musculus) |
|
GSE173897
|
RNA-seq |
95 |
Illumina HiSeq 4000 (Homo sapiens) |
|
GSE94660
|
RNA-seq |
42 |
Illumina HiSeq 2500 (Homo sapiens) |
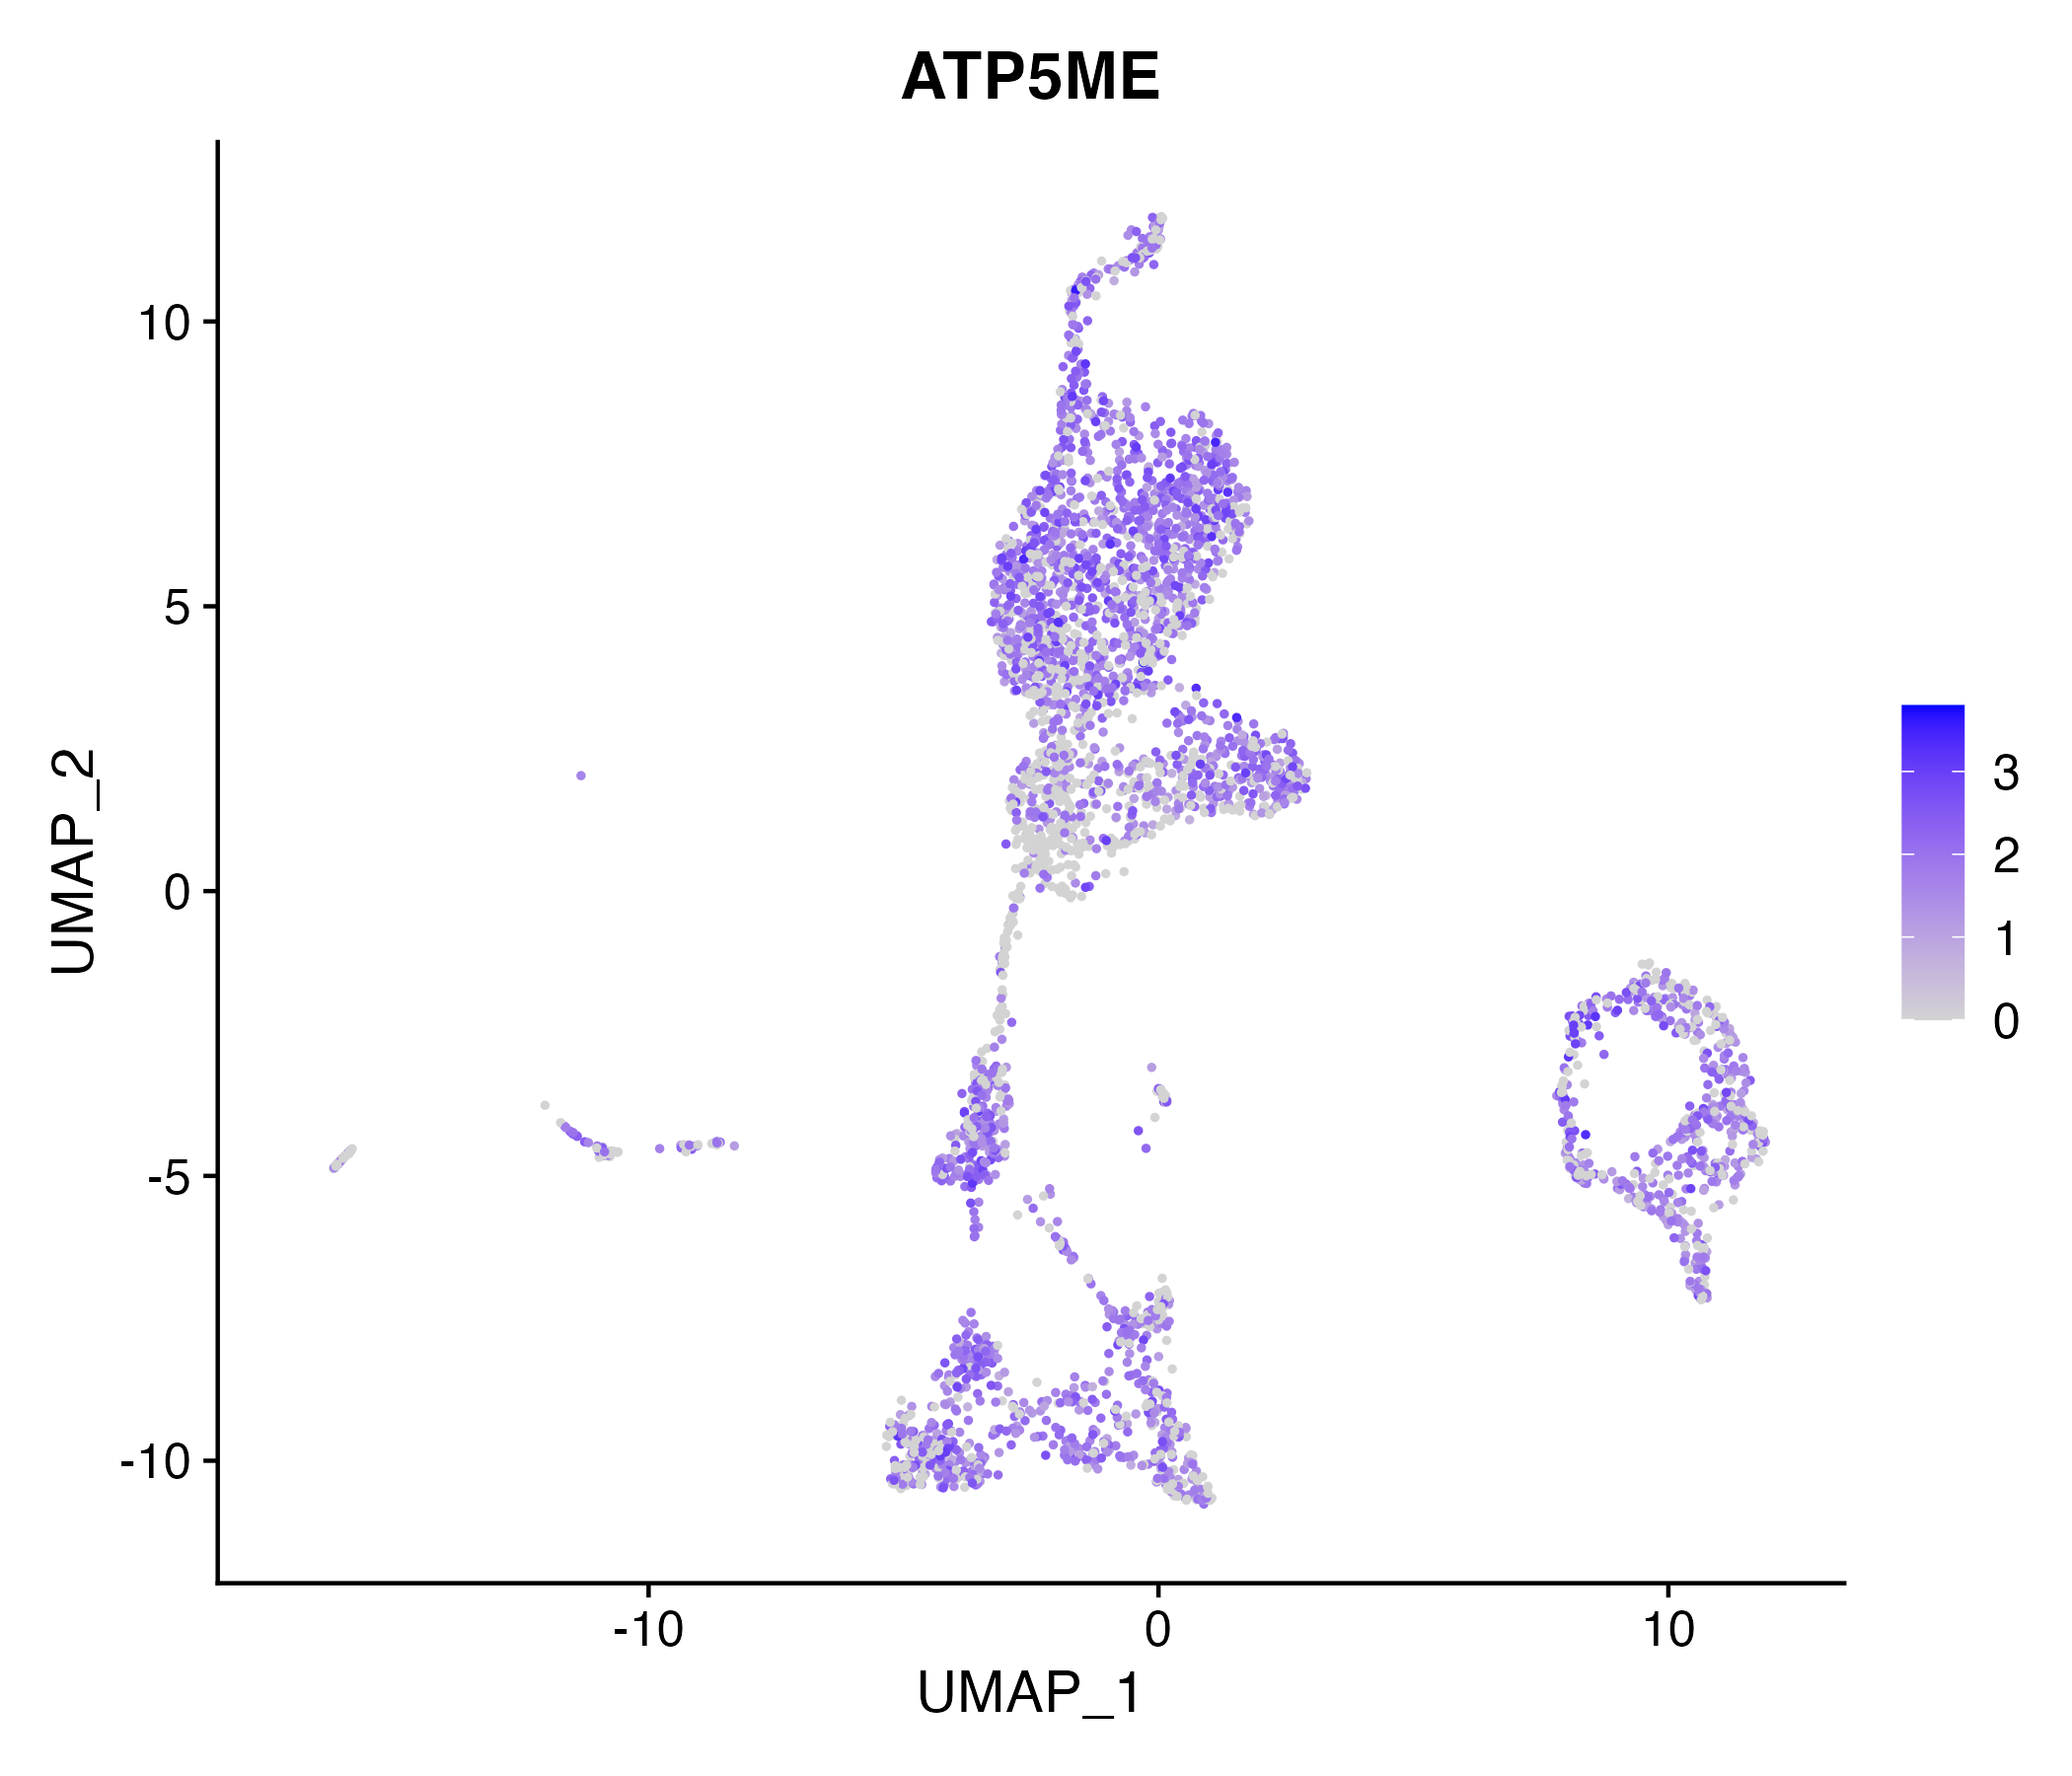
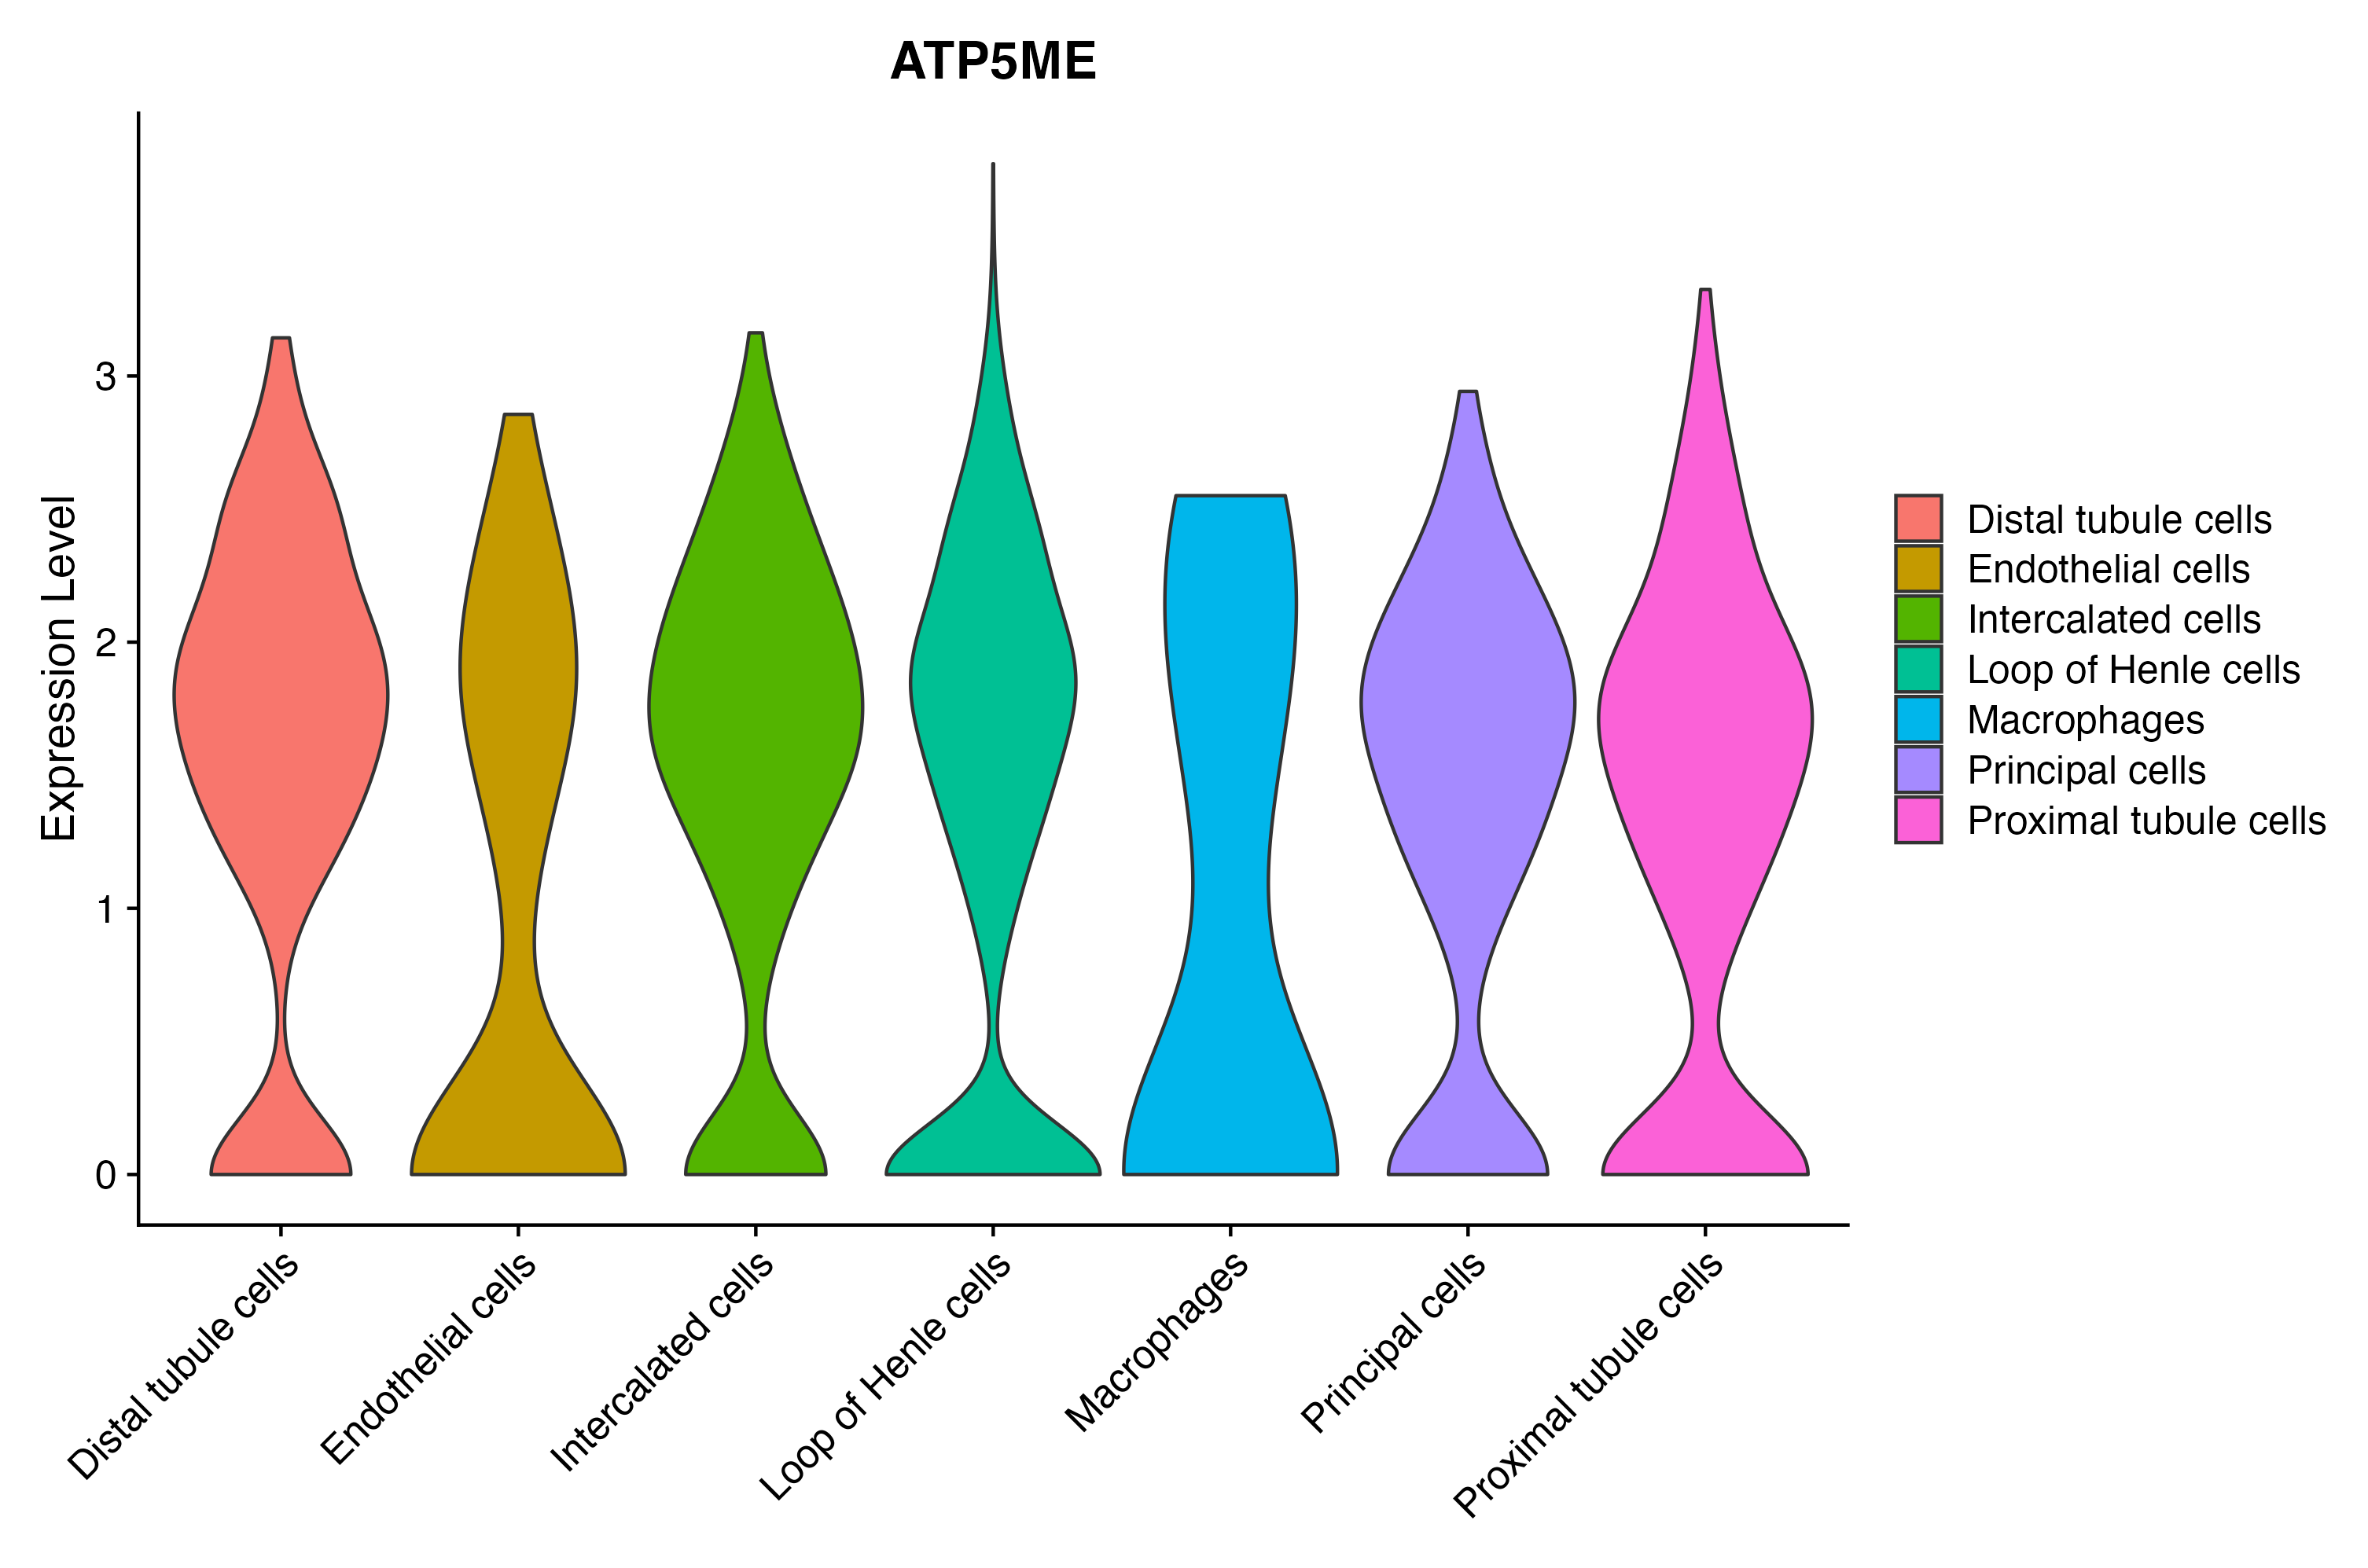
When the query gene is differentially changed in the dataset, a feature/violin plot will be displayed.
> Dataset: GSE199850 - Gene expression in cell subsets
|
|
|
|
|
|
|
|
