Gene Information
|
Gene Name
|
ATP6V0A1 |
|
Gene ID
|
535
|
|
Gene Full Name
|
ATPase H+ transporting V0 subunit a1 |
|
Gene Alias
|
ATP6N1|ATP6N1A|DEE104|NEDEBA|Stv1|VPP1|Vph1|a1 |
|
Transcripts
|
ENSG00000033627
|
|
Virus
|
HBV |
|
Gene Type
|
protein-coding |
|
HPA Location Info
|
Golgi apparatus, Vesicles;Nuclear speckles, Cytosol; 
|
|
Membrane Info
|
Disease related genes, Human disease related genes, Metabolic proteins, Potential drug targets, Predicted intracellular proteins, Predicted membrane proteins, Transporters |
|
Uniport_ID
|
Q93050
|
|
HGNC ID
|
HGNC:865
|
|
OMIM ID
|
192130 |
|
Summary
|
This gene encodes a component of vacuolar ATPase (V-ATPase), a multisubunit enzyme that mediates acidification of eukaryotic intracellular organelles. V-ATPase dependent organelle acidification is necessary for such intracellular processes as protein sorting, zymogen activation, receptor-mediated endocytosis, and synaptic vesicle proton gradient generation. V-ATPase is composed of a cytosolic V1 domain and a transmembrane V0 domain. The V1 domain consists of three A and three B subunits, two G subunits plus the C, D, E, F, and H subunits. The V1 domain contains the ATP catalytic site. The V0 domain consists of five different subunits: a, c, c', c", and d. Additional isoforms of many of the V1 and V0 subunit proteins are encoded by multiple genes or alternatively spliced transcript variants. This gene encodes one of three A subunit proteins and the encoded protein is associated with clathrin-coated vesicles. Three transcript variants encoding different isoforms have been found for this gene. [provided by RefSeq, Jul 2008] |
Target gene [ATP6V0A1] related to VISs 
Integration Table: if previous studies reported that target gene was altered by virus integration events, the overlap between VISs in this literature and Cistrome factors was listed in this section
| DVID |
Chromosome |
HM |
TFBS |
CA |
Sum of Overlapped Records |
Detail |
| 1041188 |
chr17 |
23 |
4 |
0 |
27 |
View |
Target gene [ATP6V0A1] related to Omics data
| Data ID |
Experiment type |
Sample number |
Platform |
|
GSE236281
|
RNA-seq |
12 |
Illumina MiSeq (Homo sapiens) |
|
C GSE35465
|
Chip-seq;RNA-seq |
6 |
Illumina HiSeq 2000 (Homo sapiens) |
|
GSE199850
|
scRNA-seq |
1 |
HiSeq X Ten (Homo sapiens) |
|
C GSE68402
|
Chip-seq |
26 |
Illumina MiSeq (Homo sapiens);Illumina HiSeq 2500 (Homo sapiens) |
|
GSE247322
|
scRNA-seq |
27 |
Illumina NovaSeq 6000 (Homo sapiens) |
|
TCGA_LIHC_HBV
|
DNA methylation sequencing;RNA-seq |
97 |
TCGA |
|
C GSE270130
|
Chip-seq |
27 |
Illumina NovaSeq 6000 (Homo sapiens) |
|
GSE224901
|
RNA-seq |
21 |
Illumina NovaSeq 6000 (Homo sapiens) |
|
C GSE100400
|
Chip-seq;RNA-seq;4C_cccDNA |
31 |
Illumina NextSeq 500 (Homo sapiens);Illumina NextSeq 500 (Mus musculus) |
|
GSE173897
|
RNA-seq |
95 |
Illumina HiSeq 4000 (Homo sapiens) |
|
GSE262515
|
RNA-seq |
21 |
Illumina HiSeq 2500 (Homo sapiens);Illumina HiSeq 2500 (Mus musculus) |
|
GSE110345
|
RNA-seq |
4 |
Illumina HiSeq 2500 (Homo sapiens) |
|
C GSE131257
|
ATAC-seq;RNA-seq |
19 |
Illumina HiSeq 2500 (Homo sapiens) |
|
GSE94660
|
RNA-seq |
42 |
Illumina HiSeq 2500 (Homo sapiens) |
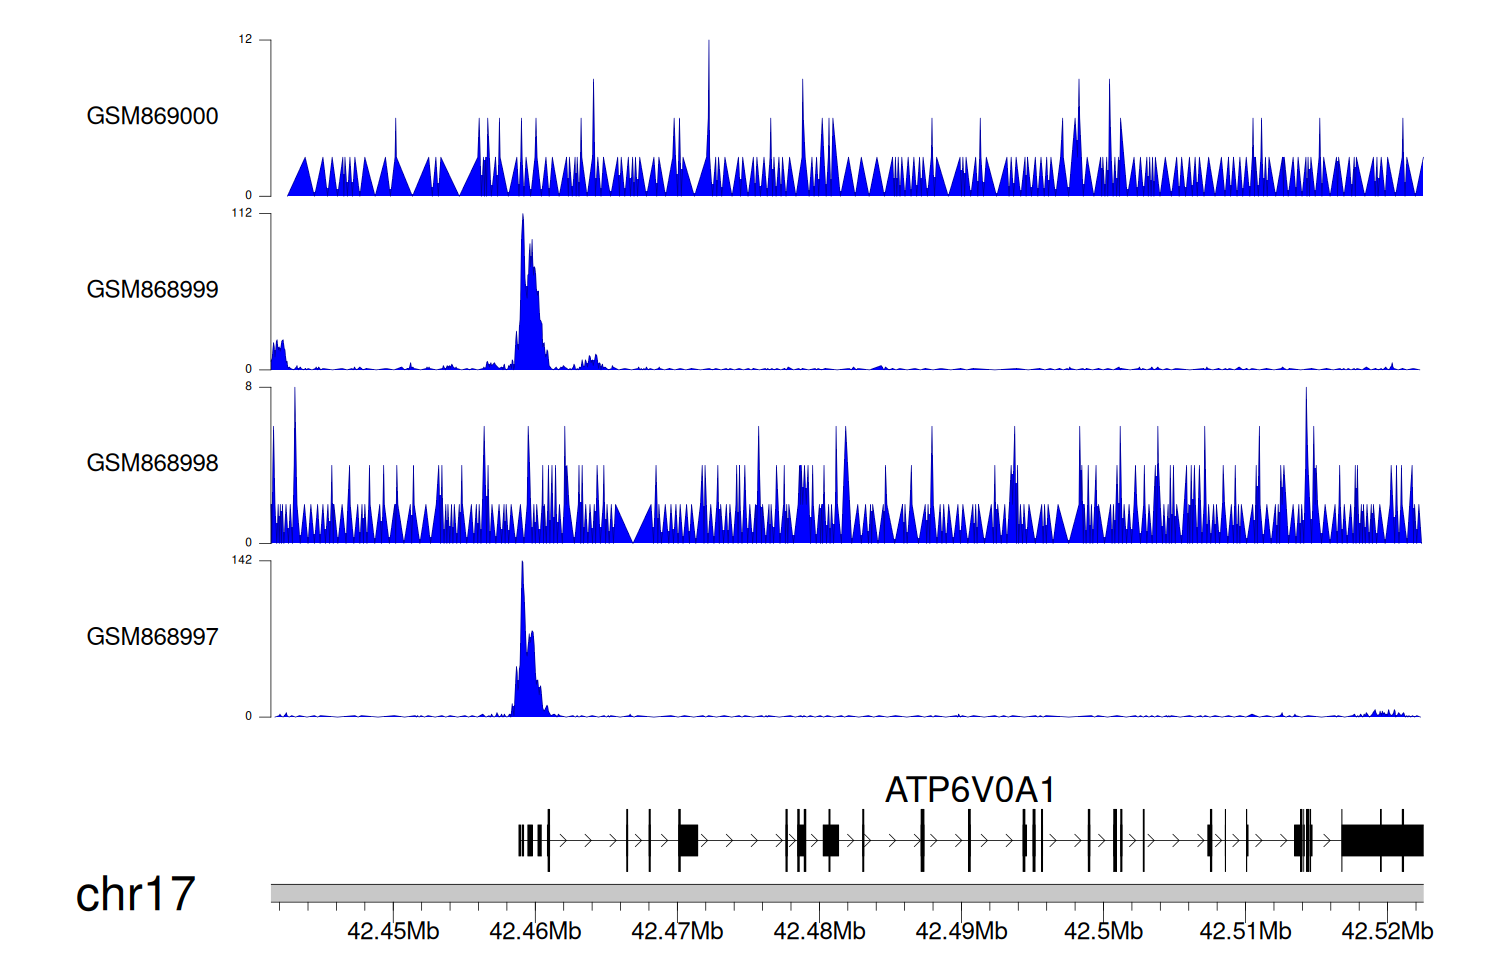
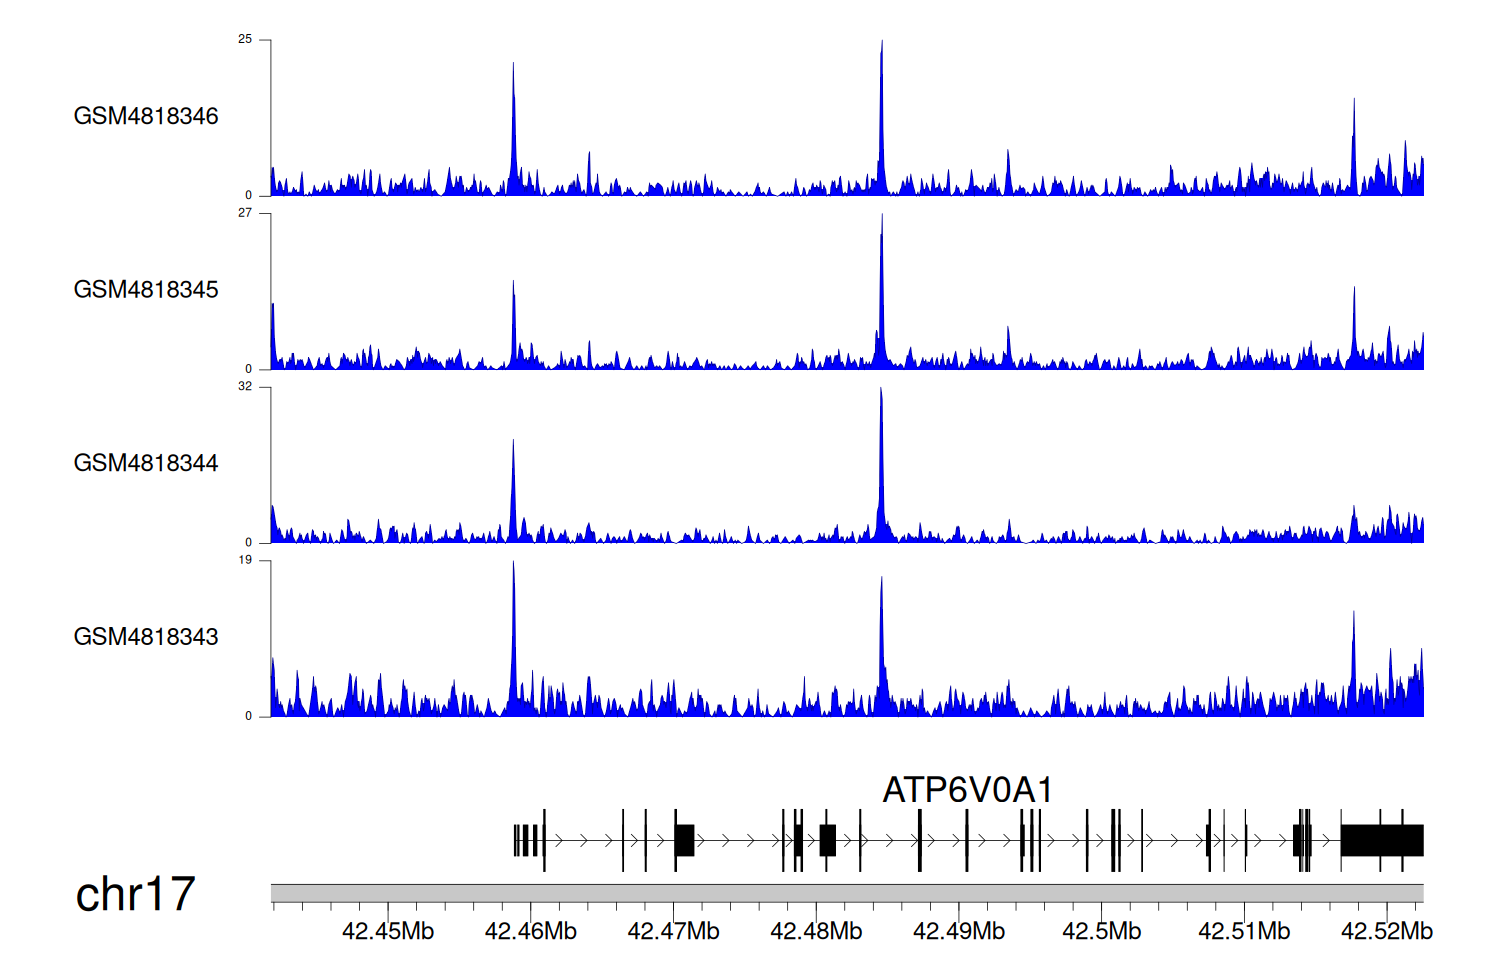
When the gene can detect a peak in the dataset, a peak plot will be displayed.
> Dataset: GSE35465 - ATP6V0A1 peak across samples
|
Peak Plot
|
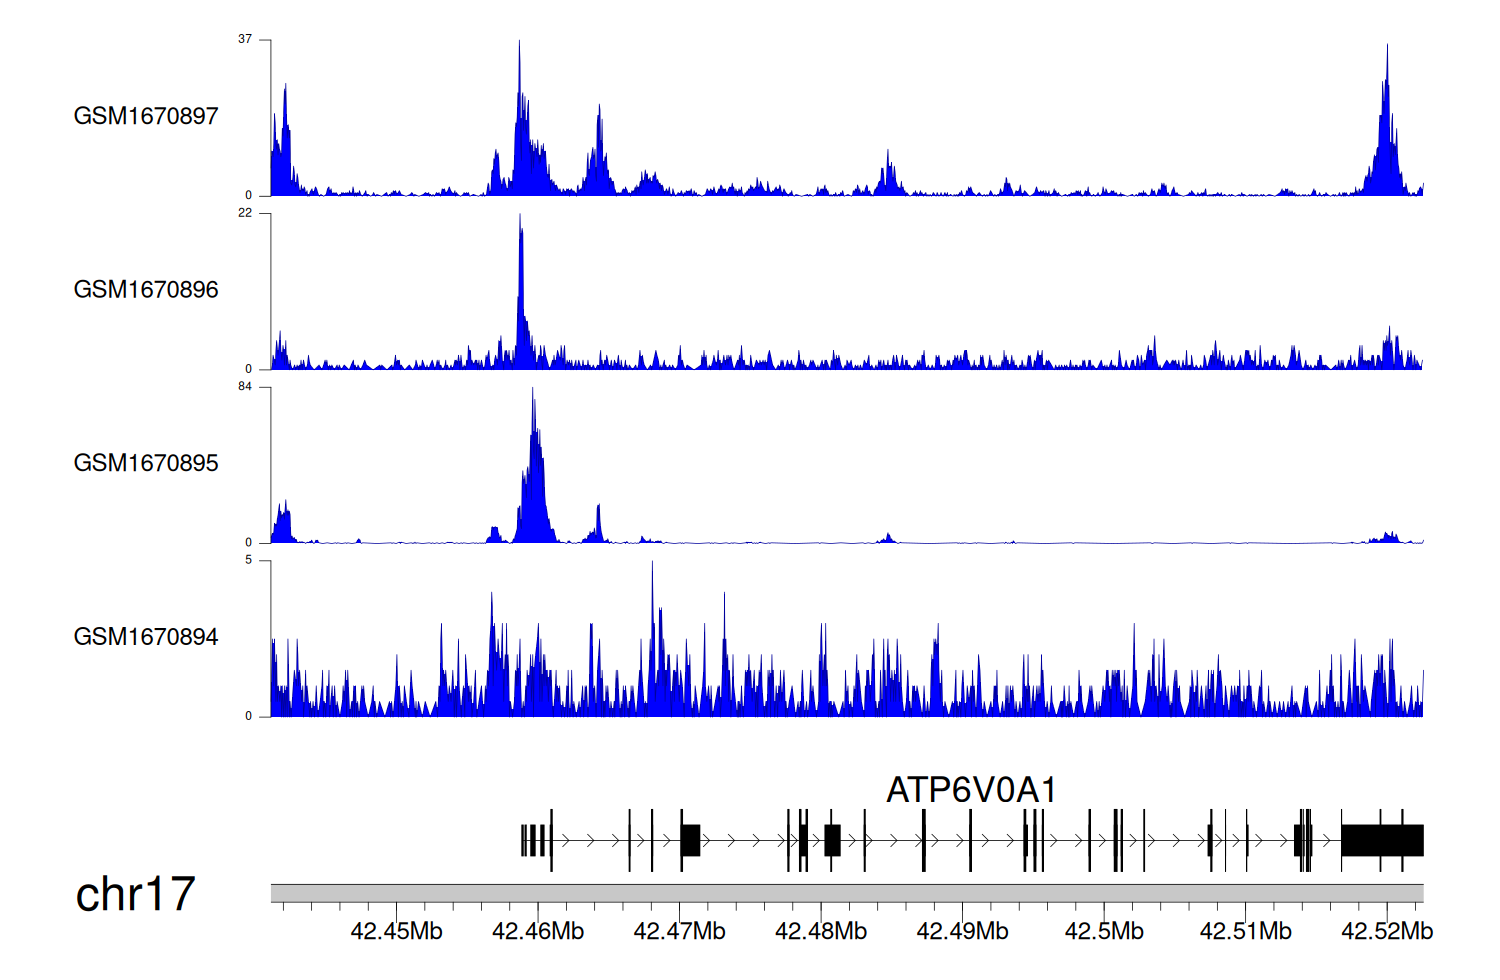
> Dataset: GSE68402 - ATP6V0A1 peak across samples
|
Peak Plot
|
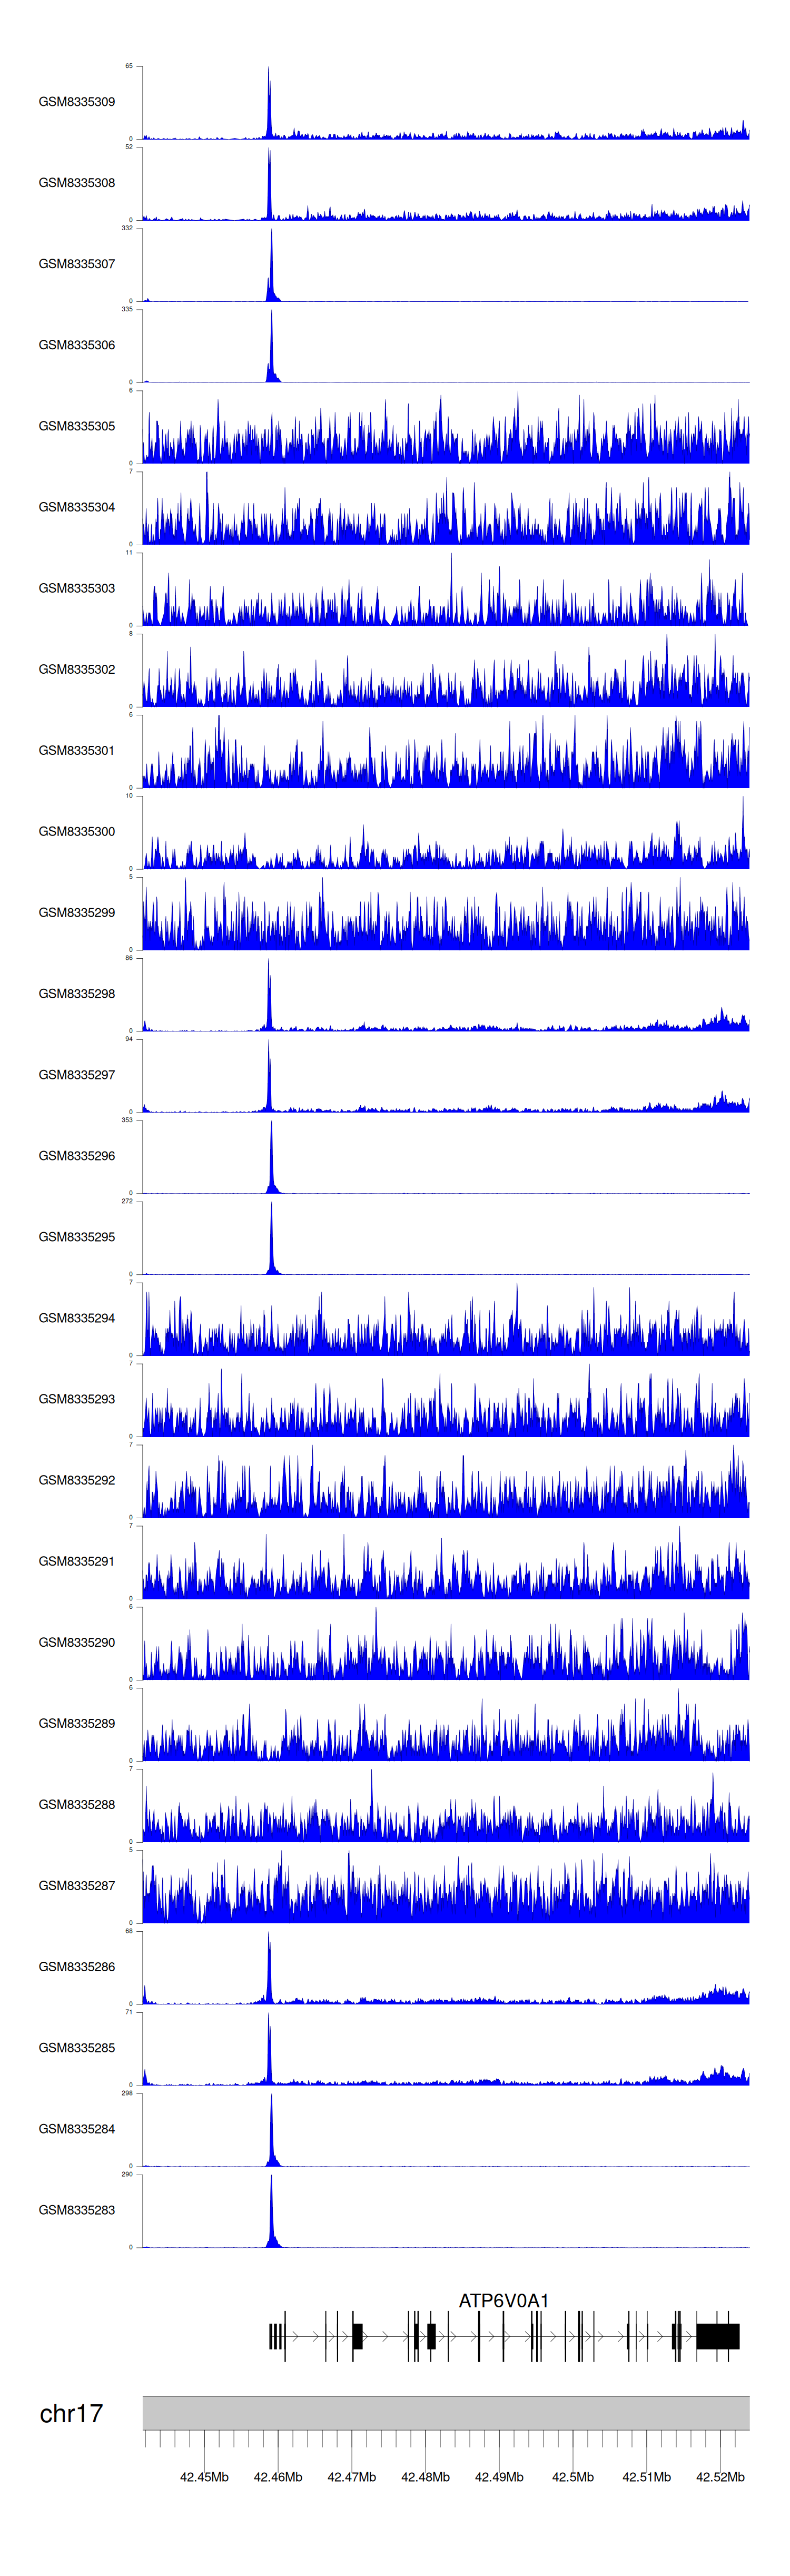
> Dataset: GSE270130 - ATP6V0A1 peak across samples
|
Peak Plot
|
> Dataset: GSE100400 - ATP6V0A1 peak across samples
|
Peak Plot
|
> Dataset: GSE131257 - ATP6V0A1 peak across samples
|
Peak Plot
|
|
|
