Gene Information
|
Gene Name
|
CD276 |
|
Gene ID
|
80381
|
|
Gene Full Name
|
CD276 molecule |
|
Gene Alias
|
4Ig-B7-H3|B7-H3|B7H3|B7RP-2 |
|
Transcripts
|
ENSG00000103855
|
|
Virus
|
HTLV1 |
|
Gene Type
|
protein-coding |
|
HPA Location Info
|
Vesicles; 
|
|
Membrane Info
|
CD markers, Predicted intracellular proteins, Predicted membrane proteins |
|
Uniport_ID
|
Q5ZPR3
|
|
HGNC ID
|
HGNC:19137
|
|
OMIM ID
|
605715 |
|
Summary
|
The protein encoded by this gene belongs to the immunoglobulin superfamily, and thought to participate in the regulation of T-cell-mediated immune response. Studies show that while the transcript of this gene is ubiquitously expressed in normal tissues and solid tumors, the protein is preferentially expressed only in tumor tissues. Additionally, it was observed that the 3' UTR of this transcript contains a target site for miR29 microRNA, and there is an inverse correlation between the expression of this protein and miR29 levels, suggesting regulation of expression of this gene product by miR29. Alternatively spliced transcript variants encoding different isoforms have been found for this gene. [provided by RefSeq, Sep 2011] |
Target gene [CD276] related to VISs 
Integration Table: if previous studies reported that target gene was altered by virus integration events, the overlap between VISs in this literature and Cistrome factors was listed in this section
| DVID |
Chromosome |
HM |
TFBS |
CA |
Sum of Overlapped Records |
Detail |
| 6024318 |
chr15 |
3 |
0 |
0 |
3 |
View |
| 6027394 |
chr15 |
2 |
0 |
0 |
2 |
View |
Target gene [CD276] related to Omics data
| Data ID |
Experiment type |
Sample number |
Platform |
|
C GSE94732
|
Chip-seq |
24 |
Illumina NextSeq 500 (Homo sapiens);illumina Genome Analyzer IIx (Homo sapiens) |
|
GSE168557
|
Expression array |
6 |
Agilent-039494 SurePrint G3 Human GE v2 8x60K Microarray 039381 (Feature Number version) |
|
GSE52244
|
Expression array |
15 |
[HuEx-1_0-st] Affymetrix Human Exon 1.0 ST Array [probe set (exon) version] |
|
GSE10789
|
Expression array |
6 |
NCI/ATC Hs-OperonV3 |
|
GSE189602
|
Methylation profiling (Array) |
4 |
Infinium MethylationEPIC |
|
GSE136189
|
Methylation profiling (Array) |
40 |
Illumina HumanMethylation450 BeadChip (HumanMethylation450_15017482);Illumina Infinium HumanMethylation850 BeadChip |
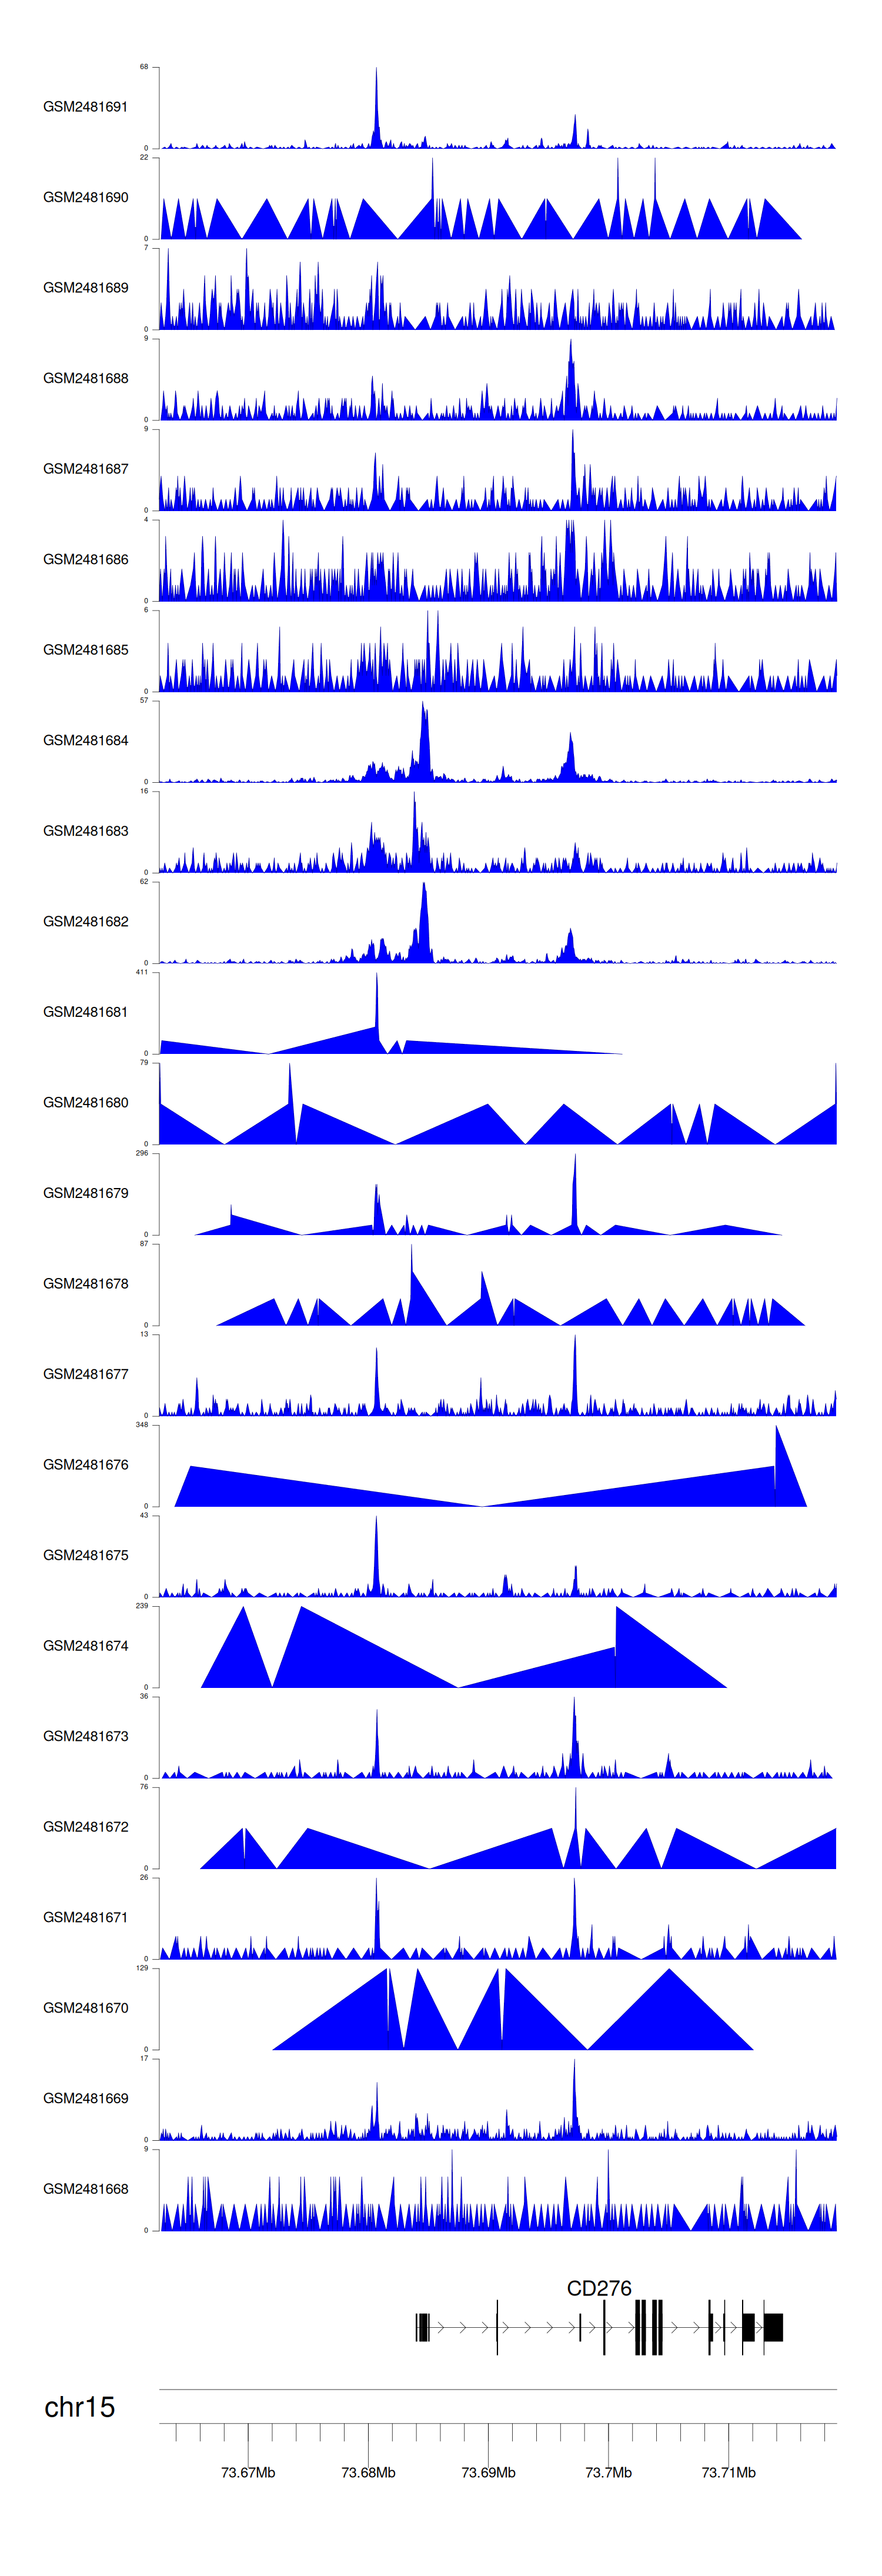
When the gene can detect a peak in the dataset, a peak plot will be displayed.
> Dataset: GSE94732 - CD276 peak across samples
|
Peak Plot
|
|
|
