Gene Information
|
Gene Name
|
CHST9 |
|
Gene ID
|
83539
|
|
Gene Full Name
|
carbohydrate sulfotransferase 9 |
|
Gene Alias
|
GALNAC4ST-2|GalNAc4ST2 |
|
Transcripts
|
ENSG00000154080
|
|
Virus
|
HTLV1 |
|
Gene Type
|
protein-coding |
|
HPA Location Info
|
Intracellular and membrane; 
|
|
Membrane Info
|
Metabolic proteins, Predicted intracellular proteins, Predicted membrane proteins |
|
Uniport_ID
|
Q7L1S5
|
|
HGNC ID
|
HGNC:19898
|
|
OMIM ID
|
610191 |
|
Summary
|
The protein encoded by this gene belongs to the sulfotransferase 2 family. It is localized to the golgi membrane, and catalyzes the transfer of sulfate to position 4 of non-reducing N-acetylgalactosamine (GalNAc) residues in both N-glycans and O-glycans. Sulfate groups on carbohydrates confer highly specific functions to glycoproteins, glycolipids, and proteoglycans, and are critical for cell-cell interaction, signal transduction, and embryonic development. Alternatively spliced transcript variants have been described for this gene. [provided by RefSeq, Aug 2011] |
Target gene [CHST9] related to VISs 
Integration Table: if previous studies reported that target gene was altered by virus integration events, the overlap between VISs in this literature and Cistrome factors was listed in this section
| DVID |
Chromosome |
HM |
TFBS |
CA |
Sum of Overlapped Records |
Detail |
| 6027897 |
chr18 |
1 |
0 |
0 |
1 |
View |
Target gene [CHST9] related to Omics data
| Data ID |
Experiment type |
Sample number |
Platform |
|
C GSE94732
|
Chip-seq |
24 |
Illumina NextSeq 500 (Homo sapiens);illumina Genome Analyzer IIx (Homo sapiens) |
|
GSE168557
|
Expression array |
6 |
Agilent-039494 SurePrint G3 Human GE v2 8x60K Microarray 039381 (Feature Number version) |
|
GSE52244
|
Expression array |
15 |
[HuEx-1_0-st] Affymetrix Human Exon 1.0 ST Array [probe set (exon) version] |
|
GSE10789
|
Expression array |
6 |
NCI/ATC Hs-OperonV3 |
|
GSE189602
|
Methylation profiling (Array) |
4 |
Infinium MethylationEPIC |
|
GSE136189
|
Methylation profiling (Array) |
40 |
Illumina HumanMethylation450 BeadChip (HumanMethylation450_15017482);Illumina Infinium HumanMethylation850 BeadChip |
When the gene can detect a peak in the dataset, a peak plot will be displayed.
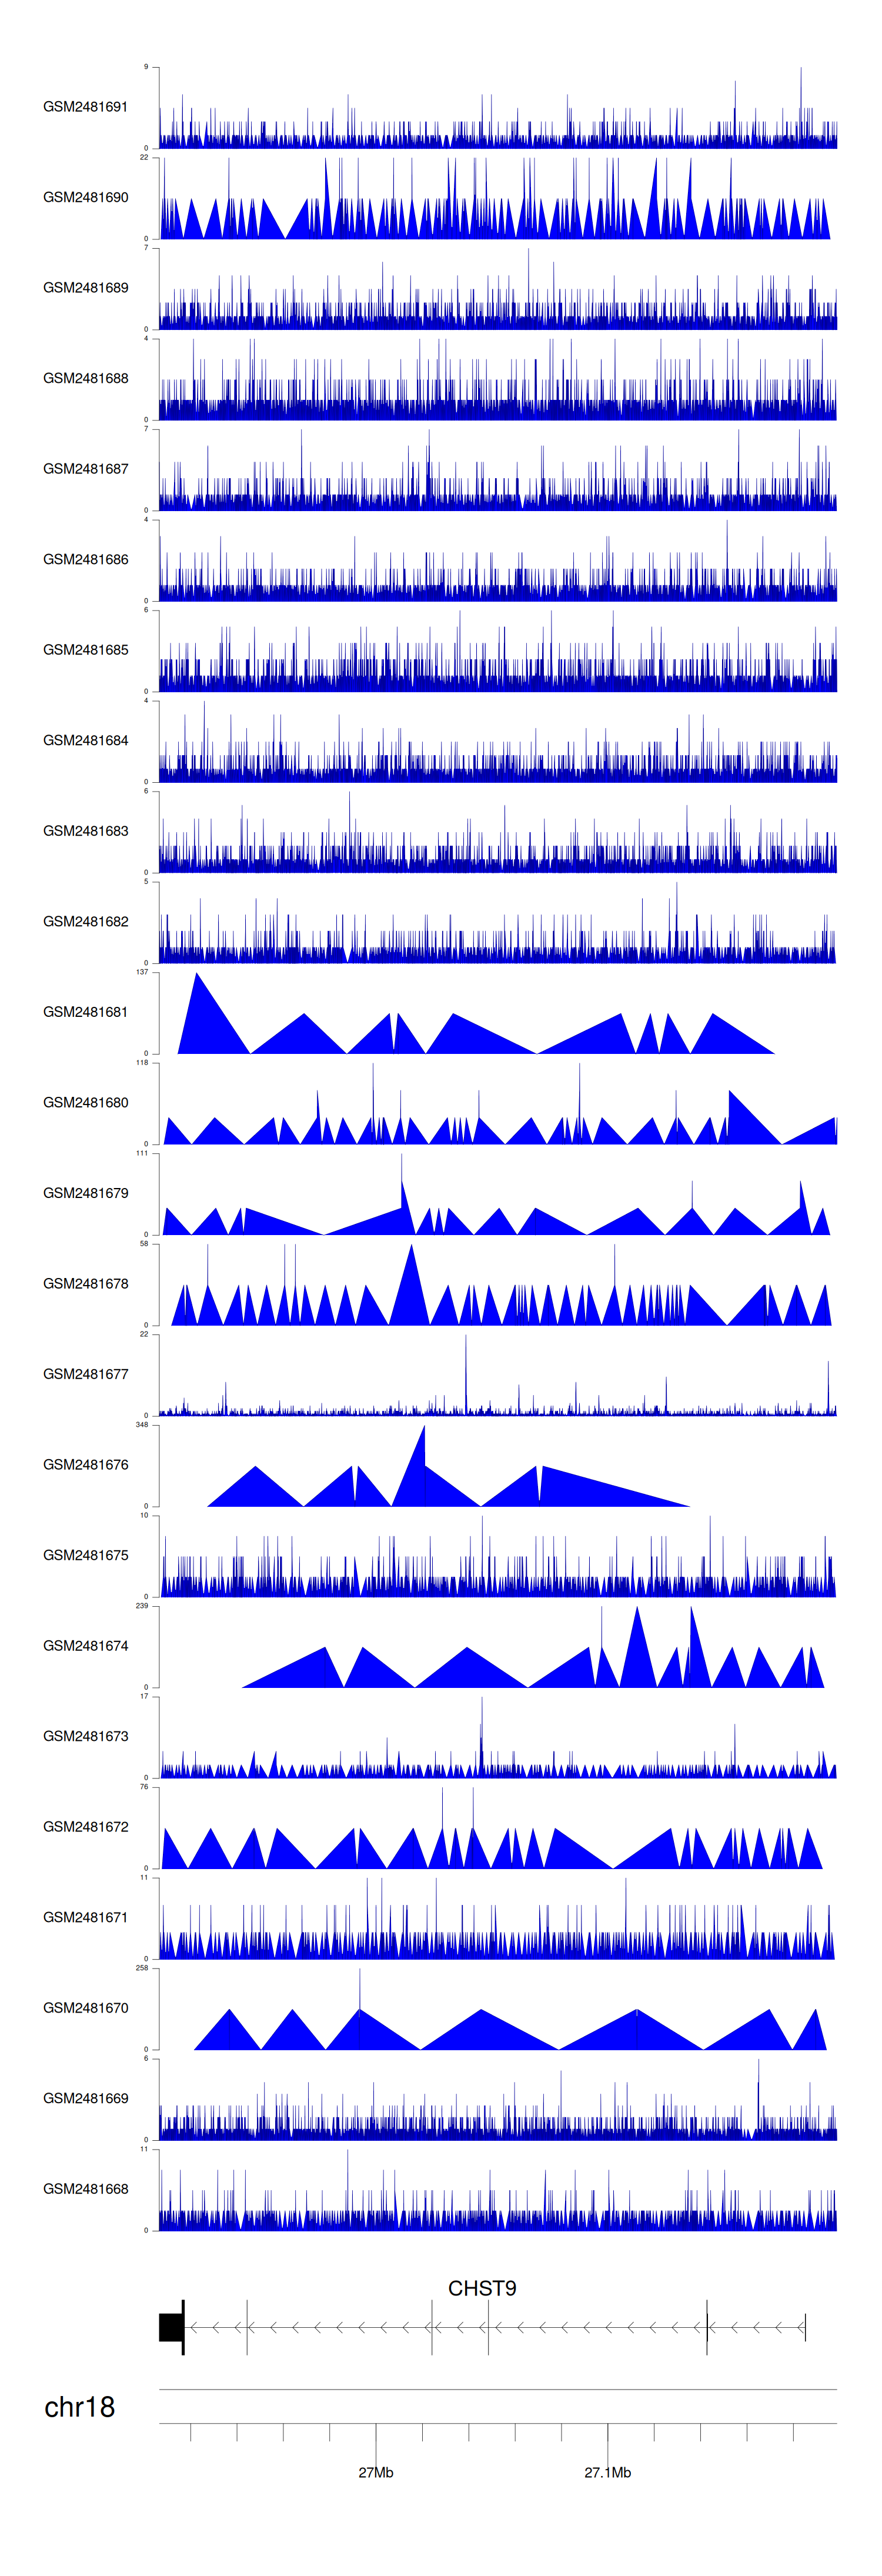
> Dataset: GSE94732 - CHST9 peak across samples
|
Peak Plot
|
|
|
