Gene Information
|
Gene Name
|
CNGB3 |
|
Gene ID
|
54714
|
|
Gene Full Name
|
cyclic nucleotide gated channel subunit beta 3 |
|
Gene Alias
|
ACHM1 |
|
Transcripts
|
ENSG00000170289
|
|
Virus
|
HTLV1 |
|
Gene Type
|
protein-coding |
|
HPA Location Info
|

|
|
Membrane Info
|
Disease related genes, Human disease related genes, Potential drug targets, Predicted intracellular proteins, Predicted membrane proteins, Transporters, Voltage-gated ion channels |
|
Uniport_ID
|
Q9NQW8
|
|
HGNC ID
|
HGNC:2153
|
|
OMIM ID
|
605080 |
|
Summary
|
This gene encodes the beta subunit of a cyclic nucleotide-gated ion channel. The encoded beta subunit appears to play a role in modulation of channel function in cone photoreceptors. This heterotetrameric channel is necessary for sensory transduction, and mutations in this gene have been associated with achromatopsia 3, progressive cone dystrophy, and juvenile macular degeneration, also known as Stargardt Disease. [provided by RefSeq, Feb 2010] |
Target gene [CNGB3] related to VISs 
Integration Table: if previous studies reported that target gene was altered by virus integration events, the overlap between VISs in this literature and Cistrome factors was listed in this section
| DVID |
Chromosome |
HM |
TFBS |
CA |
Sum of Overlapped Records |
Detail |
| 6006952 |
chr8 |
42 |
11 |
8 |
61 |
View |
| 6013279 |
chr8 |
12 |
7 |
1 |
20 |
View |
| 6022084 |
chr8 |
5 |
0 |
0 |
5 |
View |
Target gene [CNGB3] related to Omics data
| Data ID |
Experiment type |
Sample number |
Platform |
|
C GSE94732
|
Chip-seq |
24 |
Illumina NextSeq 500 (Homo sapiens);illumina Genome Analyzer IIx (Homo sapiens) |
|
GSE168557
|
Expression array |
6 |
Agilent-039494 SurePrint G3 Human GE v2 8x60K Microarray 039381 (Feature Number version) |
|
GSE52244
|
Expression array |
15 |
[HuEx-1_0-st] Affymetrix Human Exon 1.0 ST Array [probe set (exon) version] |
|
GSE10789
|
Expression array |
6 |
NCI/ATC Hs-OperonV3 |
|
GSE189602
|
Methylation profiling (Array) |
4 |
Infinium MethylationEPIC |
|
M GSE136189
|
Methylation profiling (Array) |
40 |
Illumina HumanMethylation450 BeadChip (HumanMethylation450_15017482);Illumina Infinium HumanMethylation850 BeadChip |
When the query gene is differentially changed in the dataset, a volcano/bar plot will be displayed.
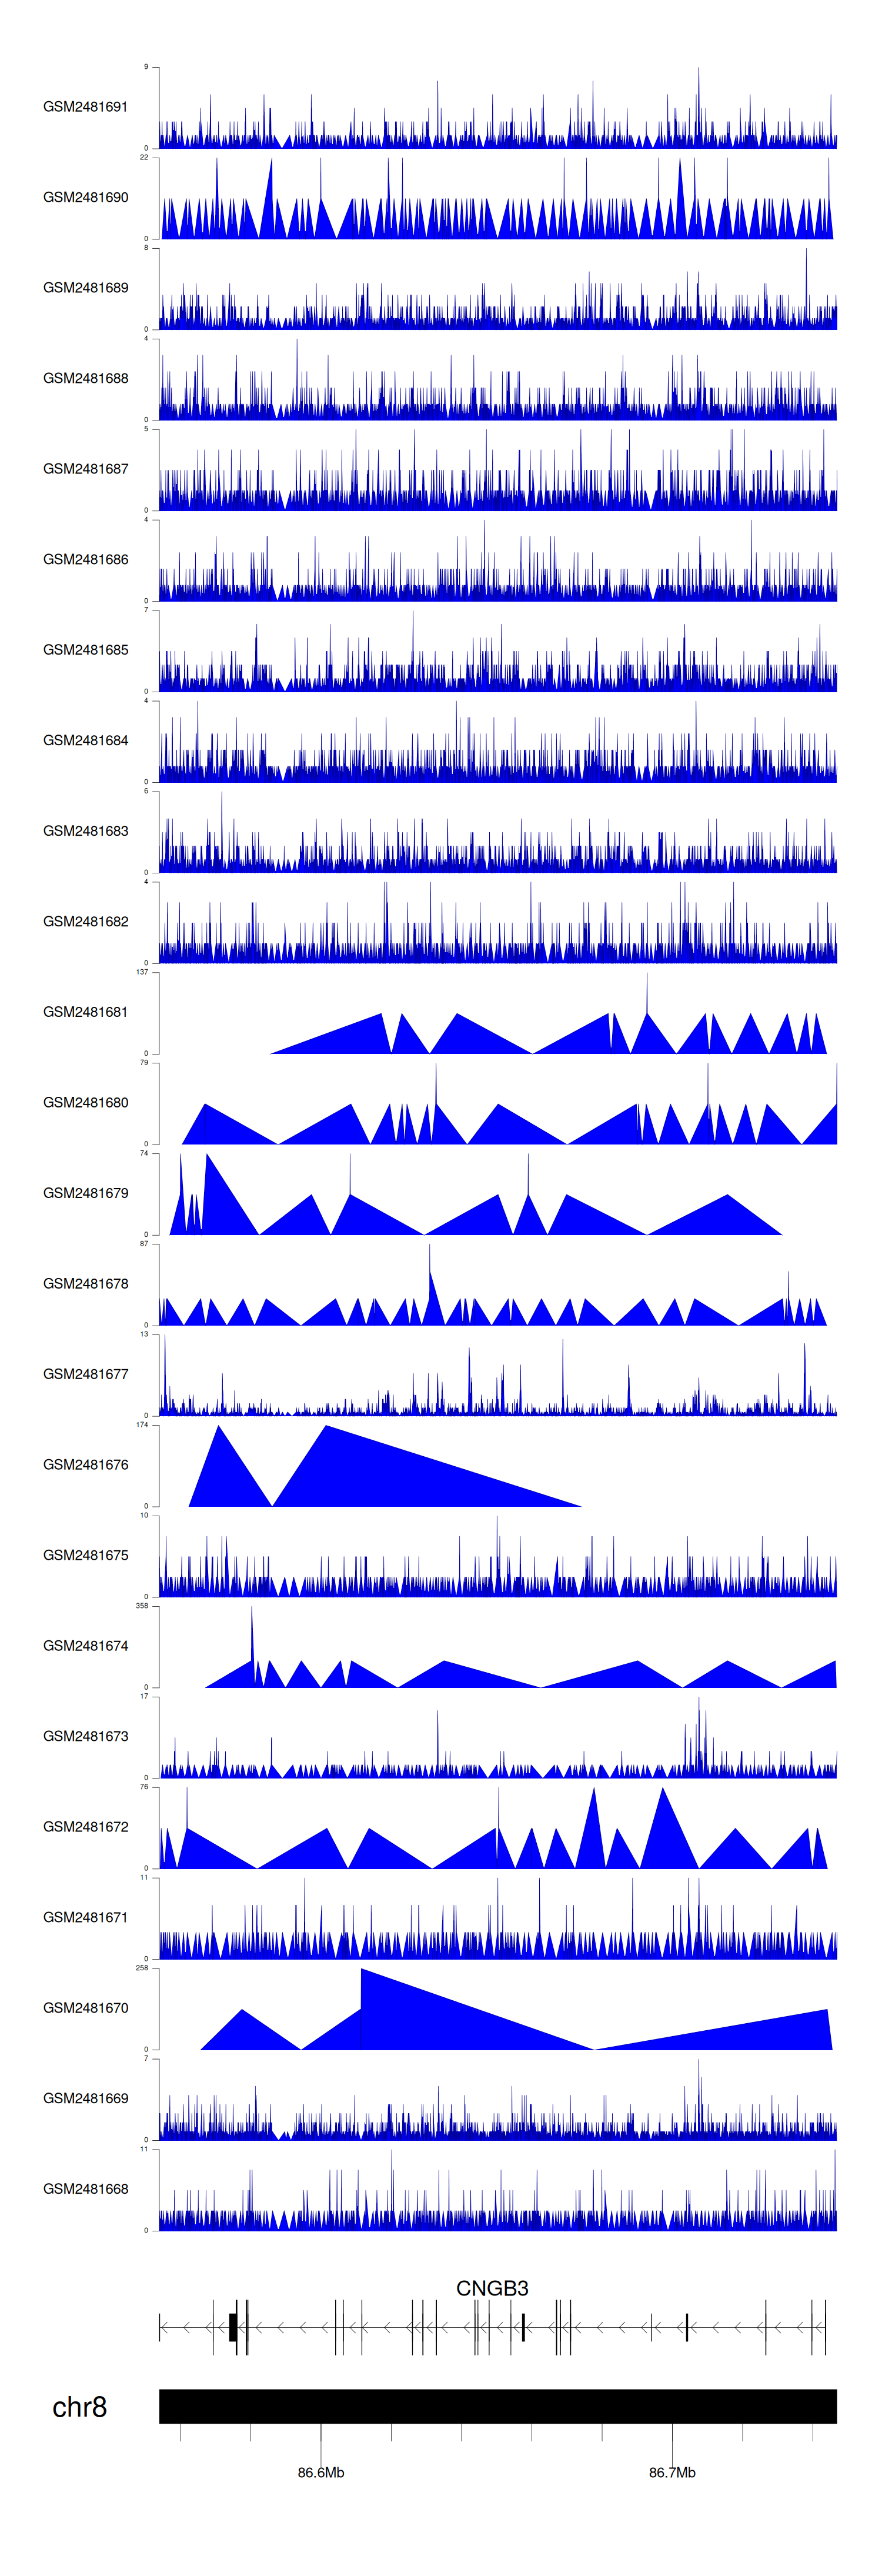
> Dataset: GSE94732 - CNGB3 peak across samples
|
Peak Plot
|
|
|
