Gene Information
|
Gene Name
|
CNTRL |
|
Gene ID
|
11064
|
|
Gene Full Name
|
centriolin |
|
Gene Alias
|
CEP1|CEP110|FAN|bA165P4.1 |
|
Transcripts
|
ENSG00000119397
|
|
Virus
|
HTLV1 |
|
Gene Type
|
protein-coding |
|
HPA Location Info
|
Centrosome, Basal body, Flagellar centriole;Golgi apparatus, Plasma membrane, Centriolar satellite, Cytosol; 
|
|
Membrane Info
|
Cancer-related genes, Disease related genes, Plasma proteins, Predicted intracellular proteins |
|
Uniport_ID
|
Q7Z7A1
|
|
HGNC ID
|
HGNC:1858
|
|
OMIM ID
|
605496 |
|
Summary
|
This gene encodes a centrosomal protein required for the centrosome to function as a microtubule organizing center. The gene product is also associated with centrosome maturation. One version of stem cell myeloproliferative disorder is the result of a reciprocal translocation between chromosomes 8 and 9, with the breakpoint associated with fibroblast growth factor receptor 1 and centrosomal protein 1. [provided by RefSeq, Jul 2008] |
Target gene [CNTRL] related to VISs 
Integration Table: if previous studies reported that target gene was altered by virus integration events, the overlap between VISs in this literature and Cistrome factors was listed in this section
| DVID |
Chromosome |
HM |
TFBS |
CA |
Sum of Overlapped Records |
Detail |
| 6001763 |
chr9 |
233 |
79 |
40 |
352 |
View |
Target gene [CNTRL] related to Omics data
| Data ID |
Experiment type |
Sample number |
Platform |
|
GSE189602
|
Methylation profiling (Array) |
4 |
Infinium MethylationEPIC |
|
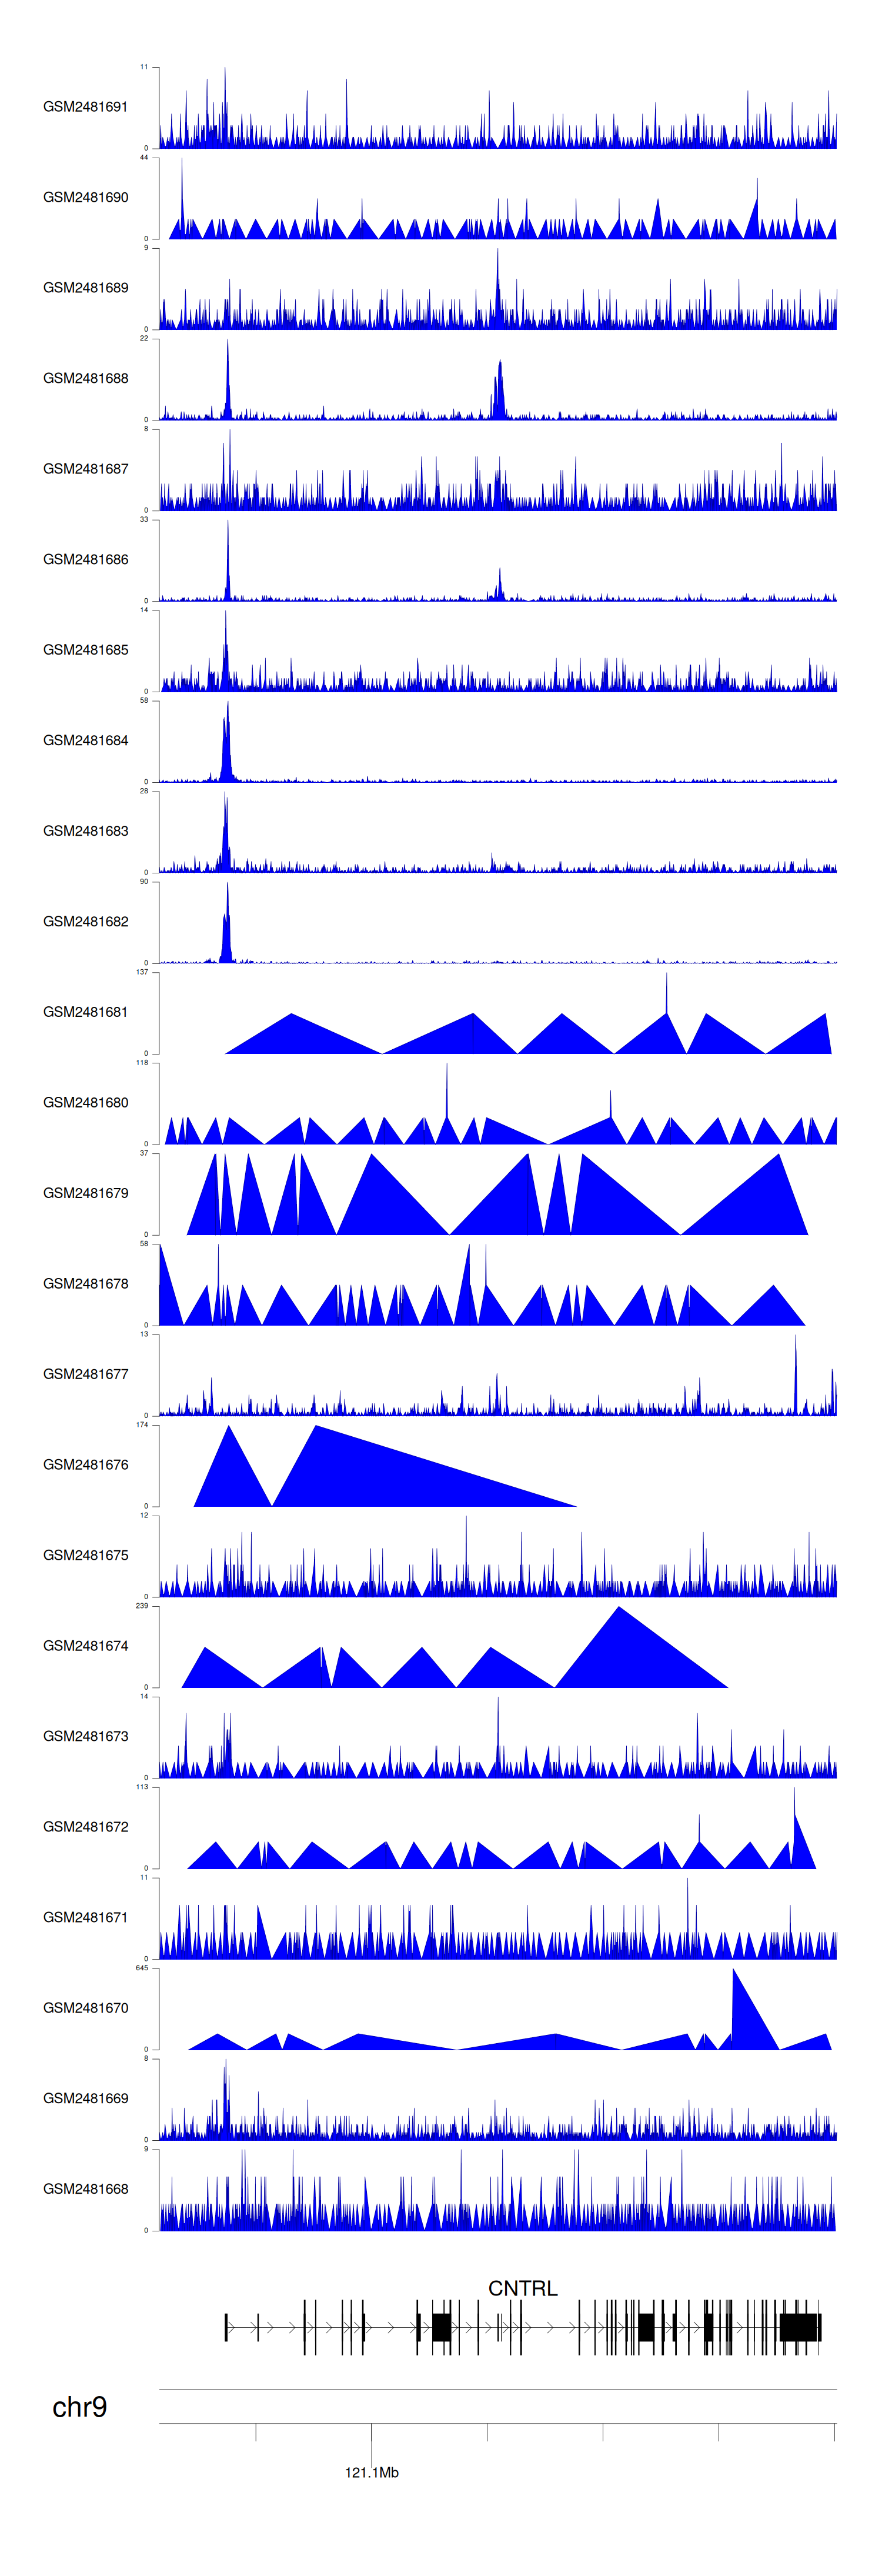
C GSE94732
|
Chip-seq |
24 |
Illumina NextSeq 500 (Homo sapiens);illumina Genome Analyzer IIx (Homo sapiens) |
|
GSE52244
|
Expression array |
15 |
[HuEx-1_0-st] Affymetrix Human Exon 1.0 ST Array [probe set (exon) version] |
|
GSE10789
|
Expression array |
6 |
NCI/ATC Hs-OperonV3 |
|
GSE224047
|
RNA-seq |
10 |
Illumina NextSeq 500 (Homo sapiens) |
|
GSE168557
|
Expression array |
6 |
Agilent-039494 SurePrint G3 Human GE v2 8x60K Microarray 039381 (Feature Number version) |
When the gene can detect a peak in the dataset, a peak plot will be displayed.
> Dataset: GSE94732 - CNTRL peak across samples
|
Peak Plot
|
|
|
