Gene Information
|
Gene Name
|
COQ8B |
|
Gene ID
|
79934
|
|
Gene Full Name
|
coenzyme Q8B |
|
Gene Alias
|
ADCK4|NPHS9 |
|
Transcripts
|
ENSG00000123815
|
|
Virus
|
HPV |
|
Gene Type
|
protein-coding |
|
HPA Location Info
|
Mitochondria; 
|
|
Membrane Info
|
Disease related genes, Enzymes, Human disease related genes, Potential drug targets, Predicted intracellular proteins |
|
Uniport_ID
|
Q96D53
|
|
HGNC ID
|
HGNC:19041
|
|
OMIM ID
|
615567 |
|
Summary
|
This gene encodes a protein with two copies of a domain found in protein kinases. The encoded protein has a complete protein kinase catalytic domain, and a truncated domain that contains only the active and binding sites of the protein kinase domain, however, it is not known whether the protein has any kinase activity. Multiple transcript variants encoding different isoforms have been found for this gene. [provided by RefSeq, Sep 2011] |
Target gene [COQ8B] related to VISs 
Integration Table: if previous studies reported that target gene was altered by virus integration events, the overlap between VISs in this literature and Cistrome factors was listed in this section
| DVID |
Chromosome |
HM |
TFBS |
CA |
Sum of Overlapped Records |
Detail |
| 5007793 |
chr19 |
1 |
1 |
0 |
2 |
View |
Target gene [COQ8B] related to Omics data
| Data ID |
Experiment type |
Sample number |
Platform |
|
C GSE183048
|
Chip-seq |
24 |
Illumina HiSeq 4000 (Homo sapiens) |
|
GSE65858
|
Expression array |
270 |
Illumina HumanHT-12 V4.0 expression beadchip |
|
GSE181805
|
Expression array |
25 |
[HTA-2_0] Affymetrix Human Transcriptome Array 2.0 [transcript (gene) version] |
|
GSE140662
|
Expression array |
8 |
[HTA-2_0] Affymetrix Human Transcriptome Array 2.0 [transcript (gene) version] |
|
C GSE143026
|
ATAC-seq;Chip-seq;RNA-seq |
30 |
Illumina HiSeq 2500 (Homo sapiens) |
|
TCGA_CESC
|
DNA methylation sequencing;RNA-seq |
288 |
TCGA |
|
GSE51993
|
Expression array |
48 |
Illumina Human v2 MicroRNA expression beadchip;Illumina HumanHT-12 V4.0 expression beadchip |
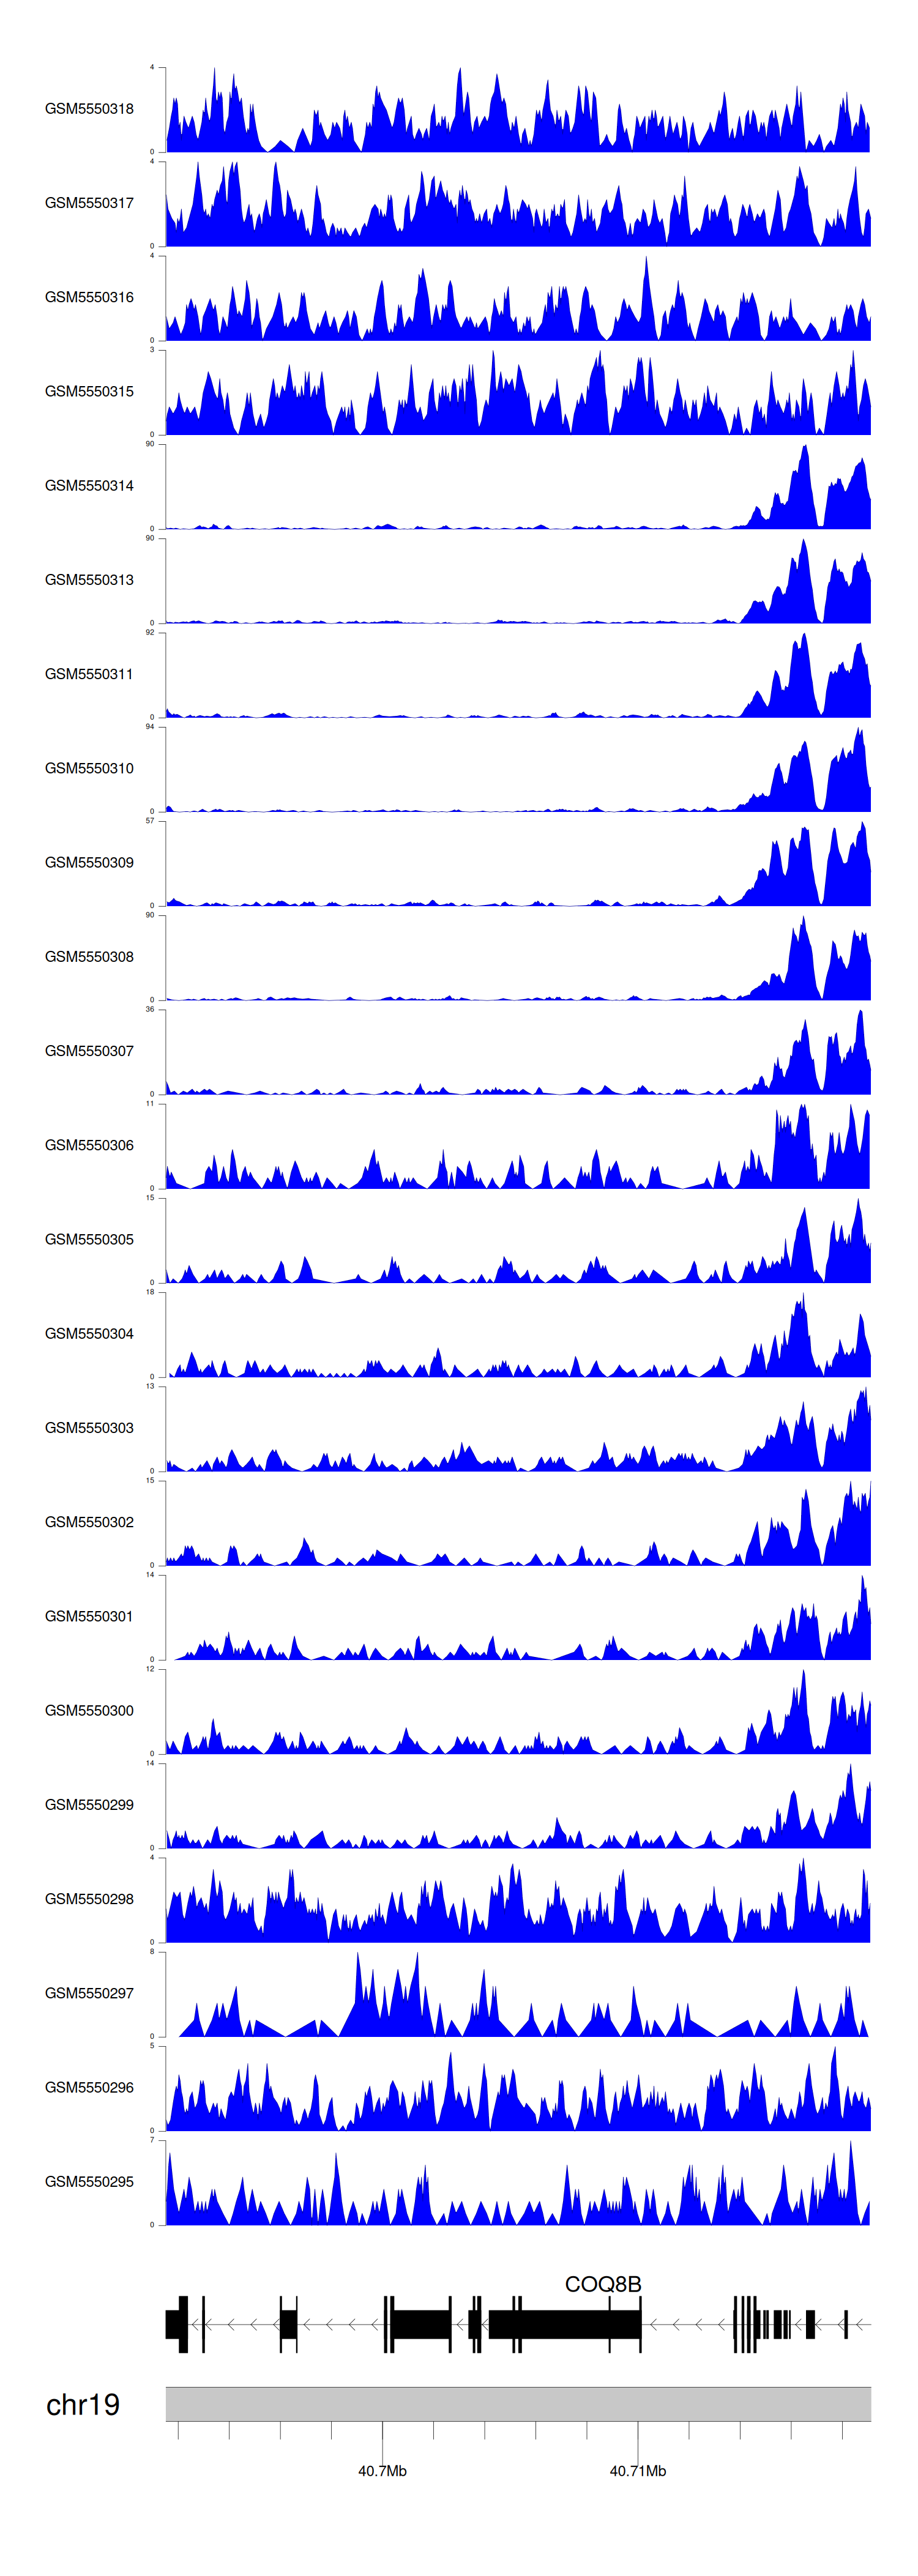
When the gene can detect a peak in the dataset, a peak plot will be displayed.
> Dataset: GSE183048 - COQ8B peak across samples
|
Peak Plot
|
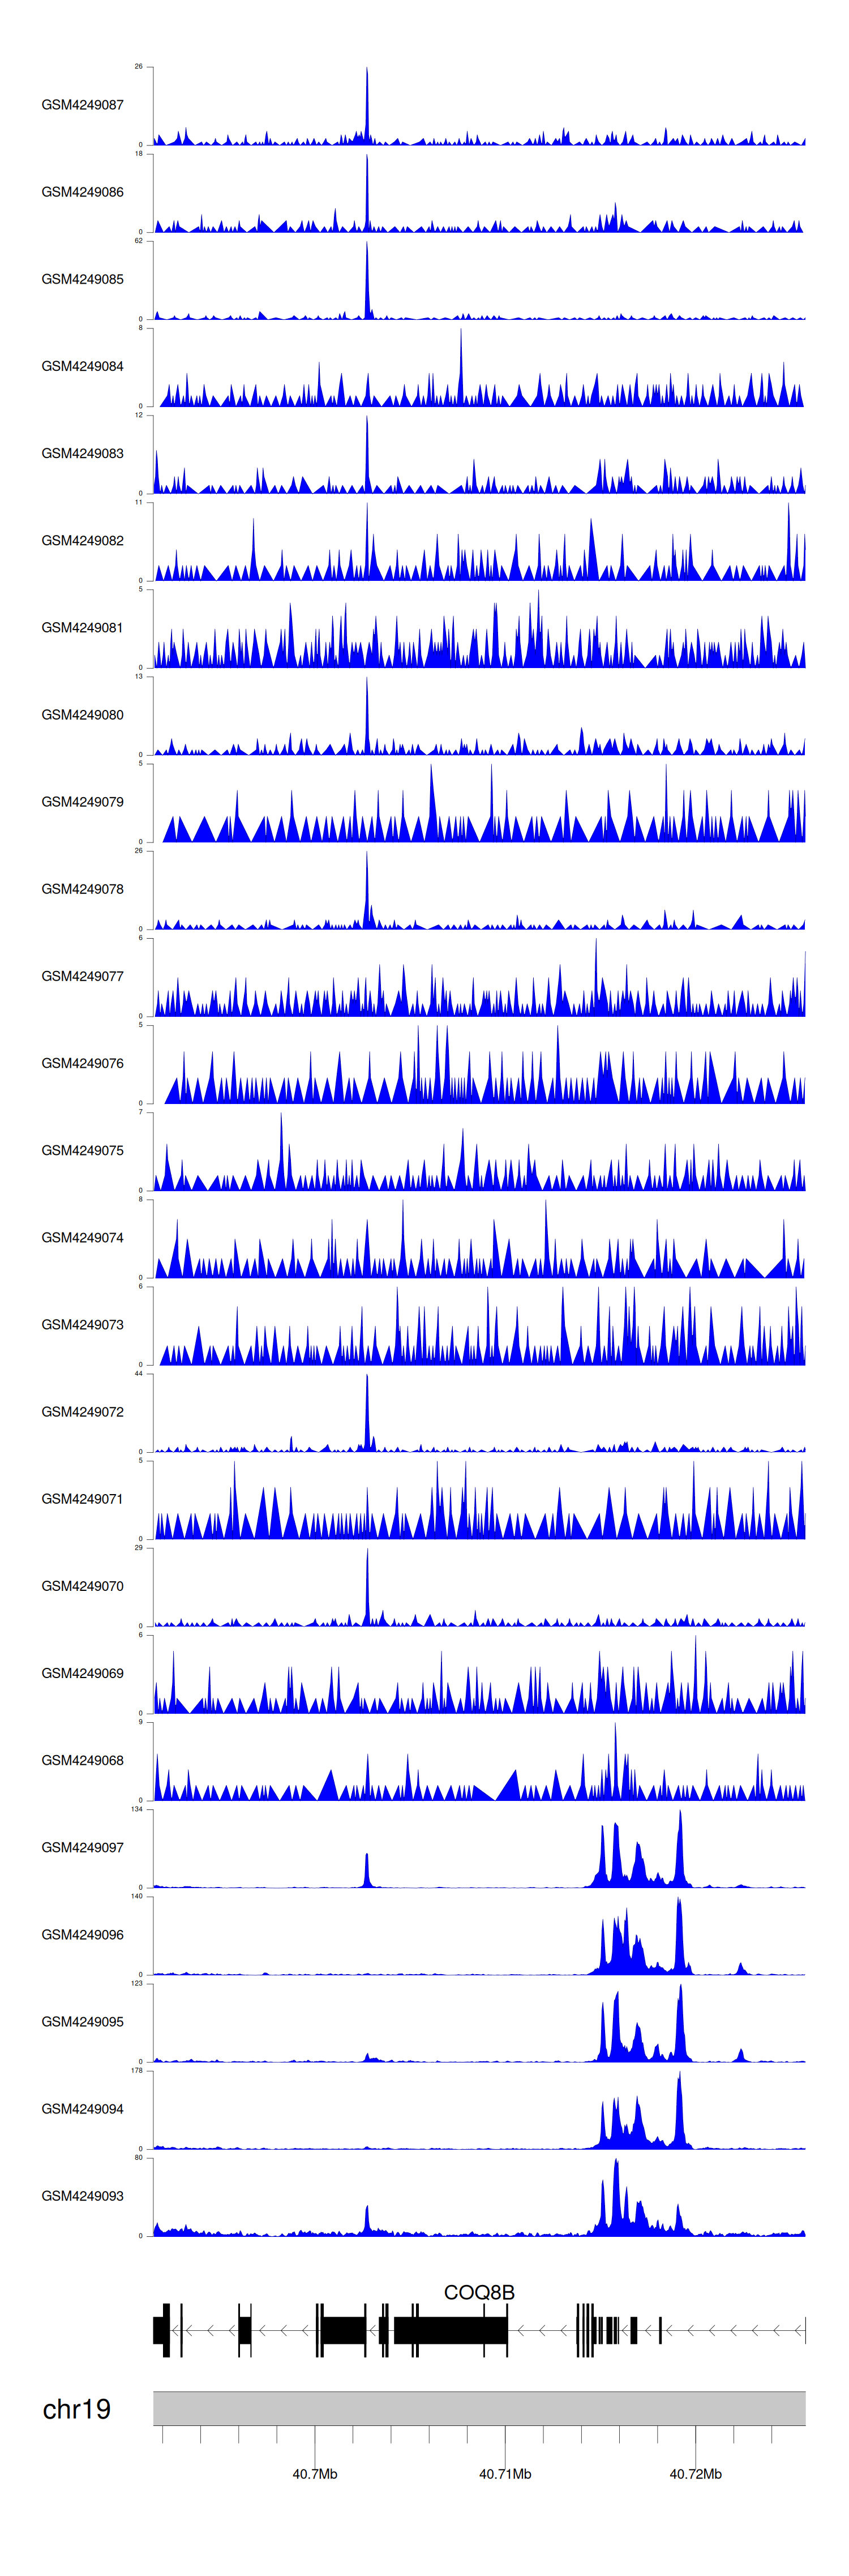
> Dataset: GSE143026 - COQ8B peak across samples
|
Peak Plot
|
|
|
