Gene Information
|
Gene Name
|
DHRS2 |
|
Gene ID
|
10202
|
|
Gene Full Name
|
dehydrogenase/reductase 2 |
|
Gene Alias
|
HEP27|SDR25C1 |
|
Transcripts
|
ENSG00000100867
|
|
Virus
|
HTLV1 |
|
Gene Type
|
protein-coding |
|
HPA Location Info
|
Mitochondria;Nucleoplasm; 
|
|
Membrane Info
|
Metabolic proteins, Predicted intracellular proteins |
|
Uniport_ID
|
Q13268
|
|
HGNC ID
|
HGNC:18349
|
|
OMIM ID
|
615194 |
|
Summary
|
This gene encodes a member of the short-chain dehydrogenases/reductases (SDR) family, which has over 46,000 members. Members of this family are enzymes that metabolize many different compounds, such as steroid hormones, prostaglandins, retinoids, lipids and xenobiotics. Alternative promoter use and alternative splicing results in multiple transcript variants. [provided by RefSeq, Feb 2017] |
Target gene [DHRS2] related to VISs 
Integration Table: if previous studies reported that target gene was altered by virus integration events, the overlap between VISs in this literature and Cistrome factors was listed in this section
| DVID |
Chromosome |
HM |
TFBS |
CA |
Sum of Overlapped Records |
Detail |
| 6004052 |
chr14 |
90 |
7 |
34 |
131 |
View |
Target gene [DHRS2] related to Omics data
| Data ID |
Experiment type |
Sample number |
Platform |
|
C GSE94732
|
Chip-seq |
24 |
Illumina NextSeq 500 (Homo sapiens);illumina Genome Analyzer IIx (Homo sapiens) |
|
GSE168557
|
Expression array |
6 |
Agilent-039494 SurePrint G3 Human GE v2 8x60K Microarray 039381 (Feature Number version) |
|
GSE52244
|
Expression array |
15 |
[HuEx-1_0-st] Affymetrix Human Exon 1.0 ST Array [probe set (exon) version] |
|
GSE10789
|
Expression array |
6 |
NCI/ATC Hs-OperonV3 |
|
GSE189602
|
Methylation profiling (Array) |
4 |
Infinium MethylationEPIC |
|
GSE136189
|
Methylation profiling (Array) |
40 |
Illumina HumanMethylation450 BeadChip (HumanMethylation450_15017482);Illumina Infinium HumanMethylation850 BeadChip |
When the gene can detect a peak in the dataset, a peak plot will be displayed.
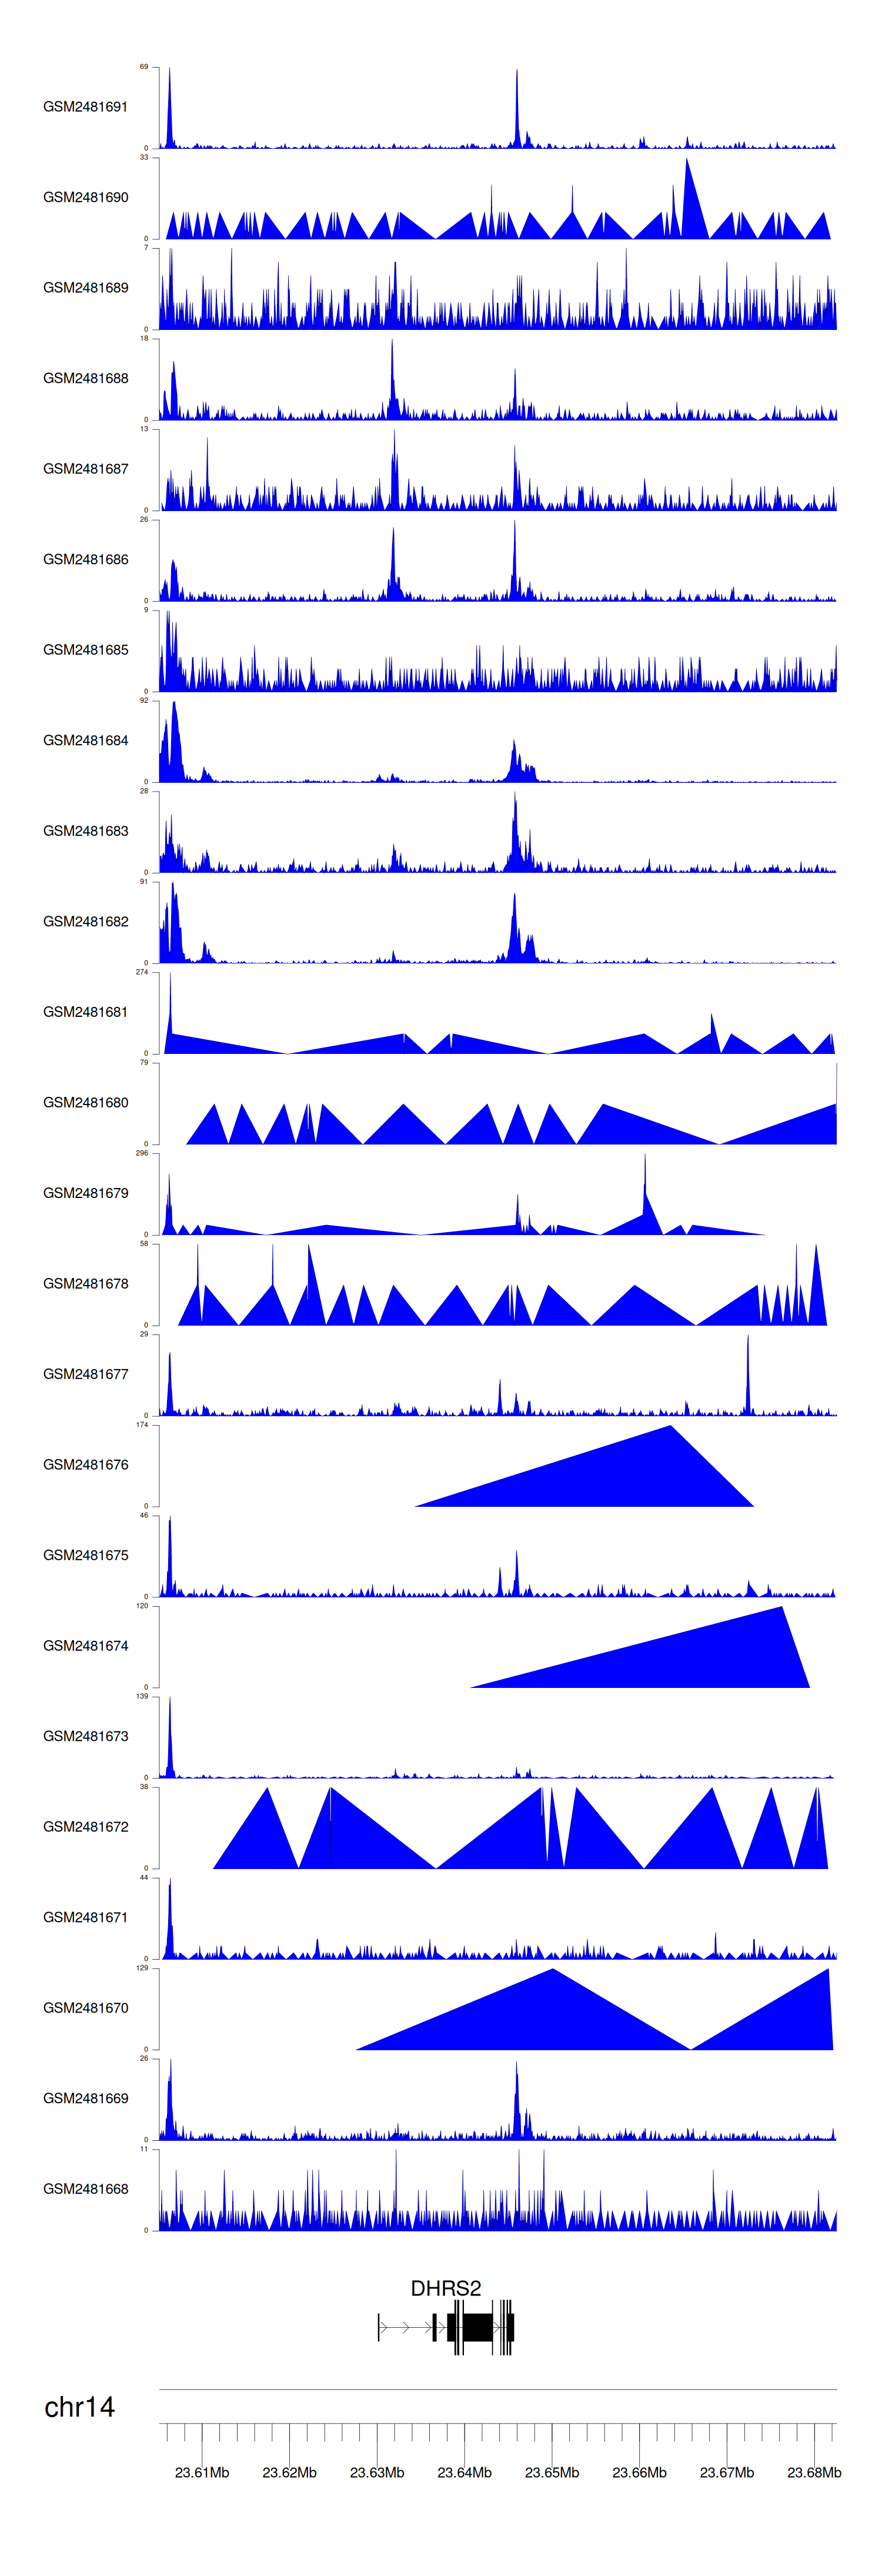
> Dataset: GSE94732 - DHRS2 peak across samples
|
Peak Plot
|
|
|
