Gene Information
|
Gene Name
|
ELOVL4 |
|
Gene ID
|
6785
|
|
Gene Full Name
|
ELOVL fatty acid elongase 4 |
|
Gene Alias
|
ADMD|CT118|ISQMR|SCA34|STGD2|STGD3 |
|
Transcripts
|
ENSG00000118402
|
|
Virus
|
HTLV1 |
|
Gene Type
|
protein-coding |
|
HPA Location Info
|

|
|
Membrane Info
|
Disease related genes, Enzymes, FDA approved drug targets, Human disease related genes, Metabolic proteins, Predicted membrane proteins |
|
Uniport_ID
|
Q9GZR5
|
|
HGNC ID
|
HGNC:14415
|
|
OMIM ID
|
605512 |
|
Summary
|
This gene encodes a membrane-bound protein which is a member of the ELO family, proteins which participate in the biosynthesis of fatty acids. Consistent with the expression of the encoded protein in photoreceptor cells of the retina, mutations and small deletions in this gene are associated with Stargardt-like macular dystrophy (STGD3) and autosomal dominant Stargardt-like macular dystrophy (ADMD), also referred to as autosomal dominant atrophic macular degeneration. [provided by RefSeq, Jul 2008] |
Target gene [ELOVL4] related to VISs 
Integration Table: if previous studies reported that target gene was altered by virus integration events, the overlap between VISs in this literature and Cistrome factors was listed in this section
| DVID |
Chromosome |
HM |
TFBS |
CA |
Sum of Overlapped Records |
Detail |
| 6015563 |
chr6 |
13 |
1 |
0 |
14 |
View |
Target gene [ELOVL4] related to Omics data
| Data ID |
Experiment type |
Sample number |
Platform |
|
C GSE94732
|
Chip-seq |
24 |
Illumina NextSeq 500 (Homo sapiens);illumina Genome Analyzer IIx (Homo sapiens) |
|
GSE168557
|
Expression array |
6 |
Agilent-039494 SurePrint G3 Human GE v2 8x60K Microarray 039381 (Feature Number version) |
|
GSE52244
|
Expression array |
15 |
[HuEx-1_0-st] Affymetrix Human Exon 1.0 ST Array [probe set (exon) version] |
|
GSE10789
|
Expression array |
6 |
NCI/ATC Hs-OperonV3 |
|
GSE189602
|
Methylation profiling (Array) |
4 |
Infinium MethylationEPIC |
|
GSE136189
|
Methylation profiling (Array) |
40 |
Illumina HumanMethylation450 BeadChip (HumanMethylation450_15017482);Illumina Infinium HumanMethylation850 BeadChip |
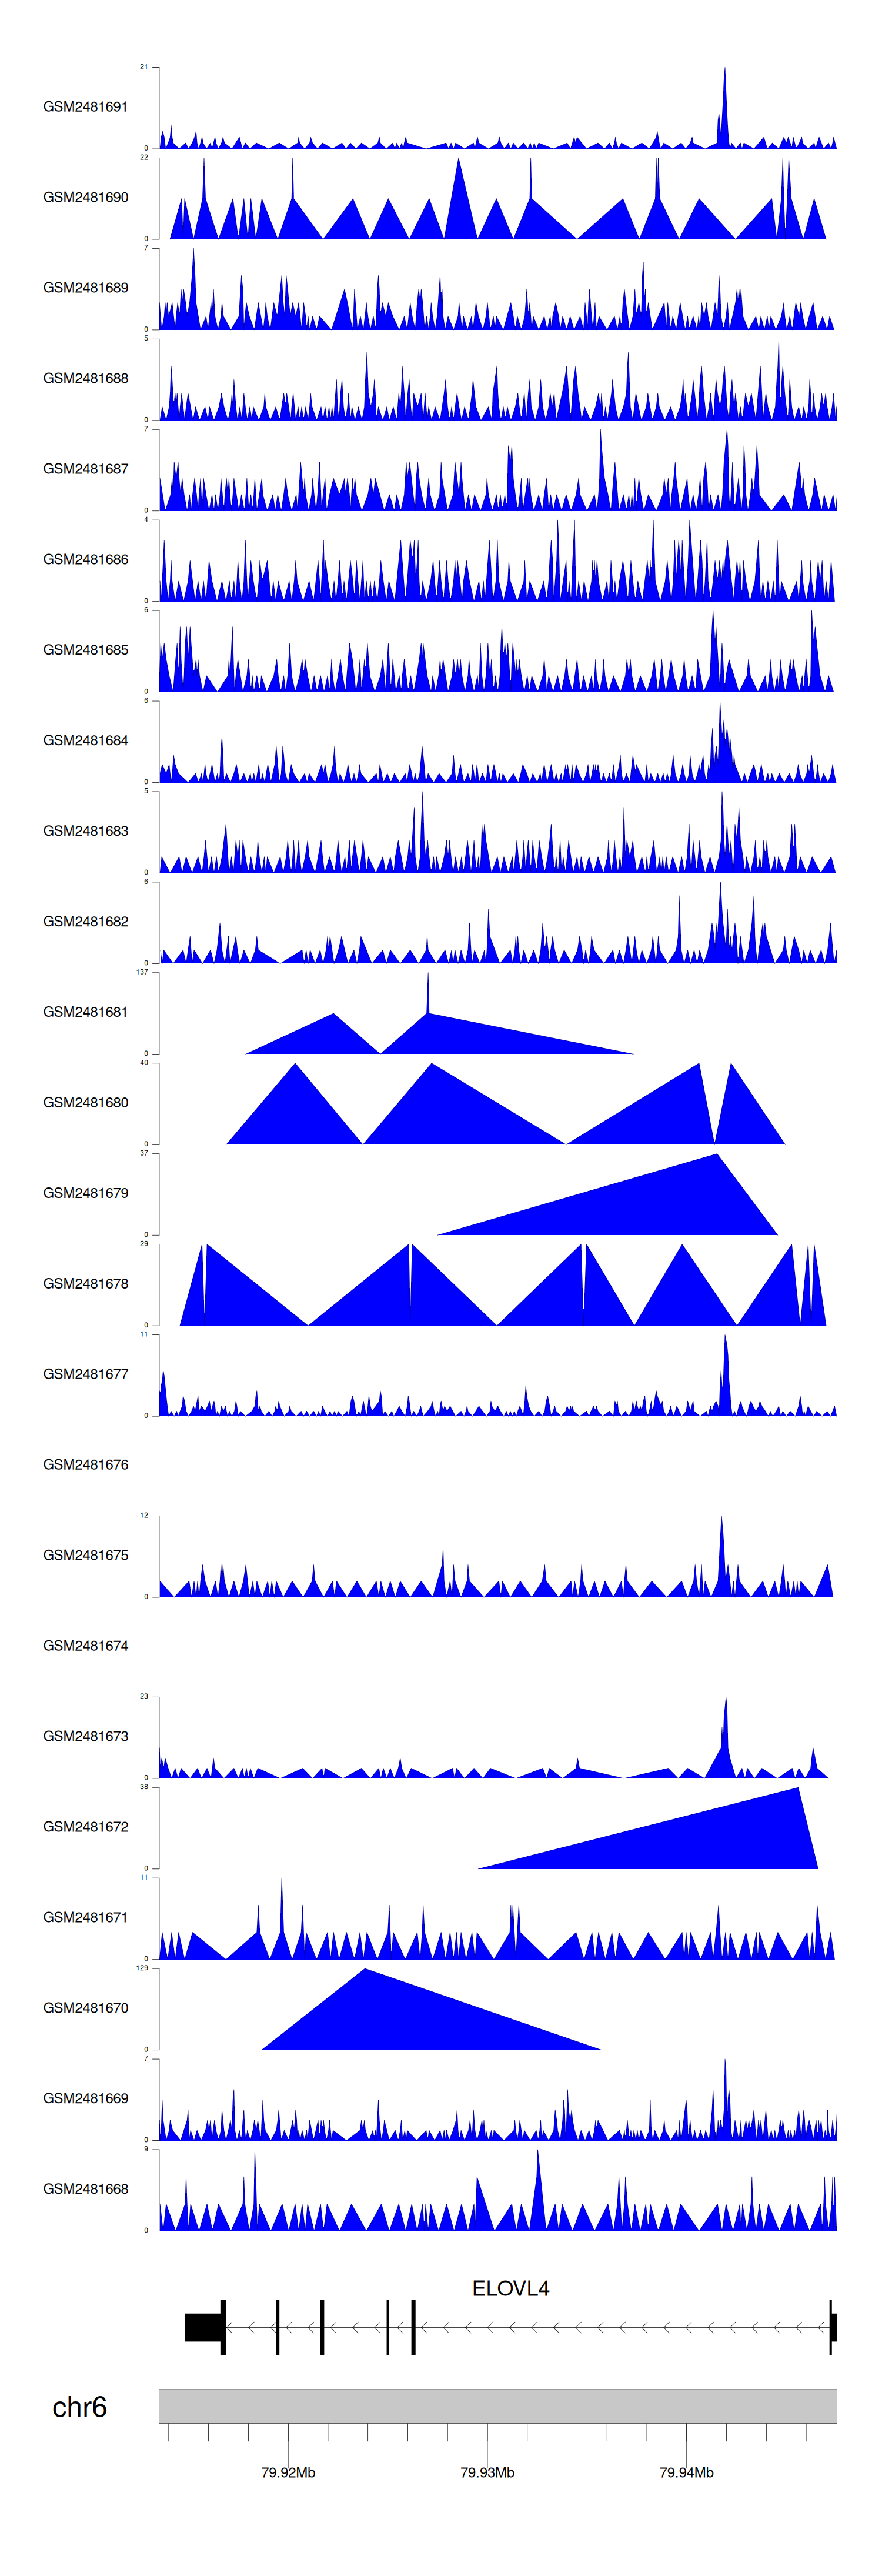
When the gene can detect a peak in the dataset, a peak plot will be displayed.
> Dataset: GSE94732 - ELOVL4 peak across samples
|
Peak Plot
|
|
|
