Gene Information
|
Gene Name
|
ENOX1 |
|
Gene ID
|
55068
|
|
Gene Full Name
|
ecto-NOX disulfide-thiol exchanger 1 |
|
Gene Alias
|
CNOX|PIG38|bA64J21.1|cCNOX |
|
Transcripts
|
ENSG00000120658
|
|
Virus
|
HTLV1 |
|
Gene Type
|
protein-coding |
|
HPA Location Info
|
Plasma membrane;Intracellular and membrane; 
|
|
Membrane Info
|
Predicted intracellular proteins |
|
Uniport_ID
|
Q8TC92
|
|
HGNC ID
|
HGNC:25474
|
|
OMIM ID
|
610914 |
|
Summary
|
The protein encoded by this gene is involved in plasma membrane electron transport pathways. The encoded protein has both a hydroquinone (NADH) oxidase activity and a protein disulfide-thiol interchange activity. The two activities cycle with a periodicity of 24 minutes, with one activity being at its peak when the other is at its lowest. [provided by RefSeq, Dec 2016] |
Target gene [ENOX1] related to VISs 
Integration Table: if previous studies reported that target gene was altered by virus integration events, the overlap between VISs in this literature and Cistrome factors was listed in this section
Target gene [ENOX1] related to Omics data
| Data ID |
Experiment type |
Sample number |
Platform |
|
C GSE94732
|
Chip-seq |
24 |
Illumina NextSeq 500 (Homo sapiens);illumina Genome Analyzer IIx (Homo sapiens) |
|
GSE168557
|
Expression array |
6 |
Agilent-039494 SurePrint G3 Human GE v2 8x60K Microarray 039381 (Feature Number version) |
|
GSE52244
|
Expression array |
15 |
[HuEx-1_0-st] Affymetrix Human Exon 1.0 ST Array [probe set (exon) version] |
|
GSE10789
|
Expression array |
6 |
NCI/ATC Hs-OperonV3 |
|
GSE189602
|
Methylation profiling (Array) |
4 |
Infinium MethylationEPIC |
|
GSE136189
|
Methylation profiling (Array) |
40 |
Illumina HumanMethylation450 BeadChip (HumanMethylation450_15017482);Illumina Infinium HumanMethylation850 BeadChip |
When the gene can detect a peak in the dataset, a peak plot will be displayed.
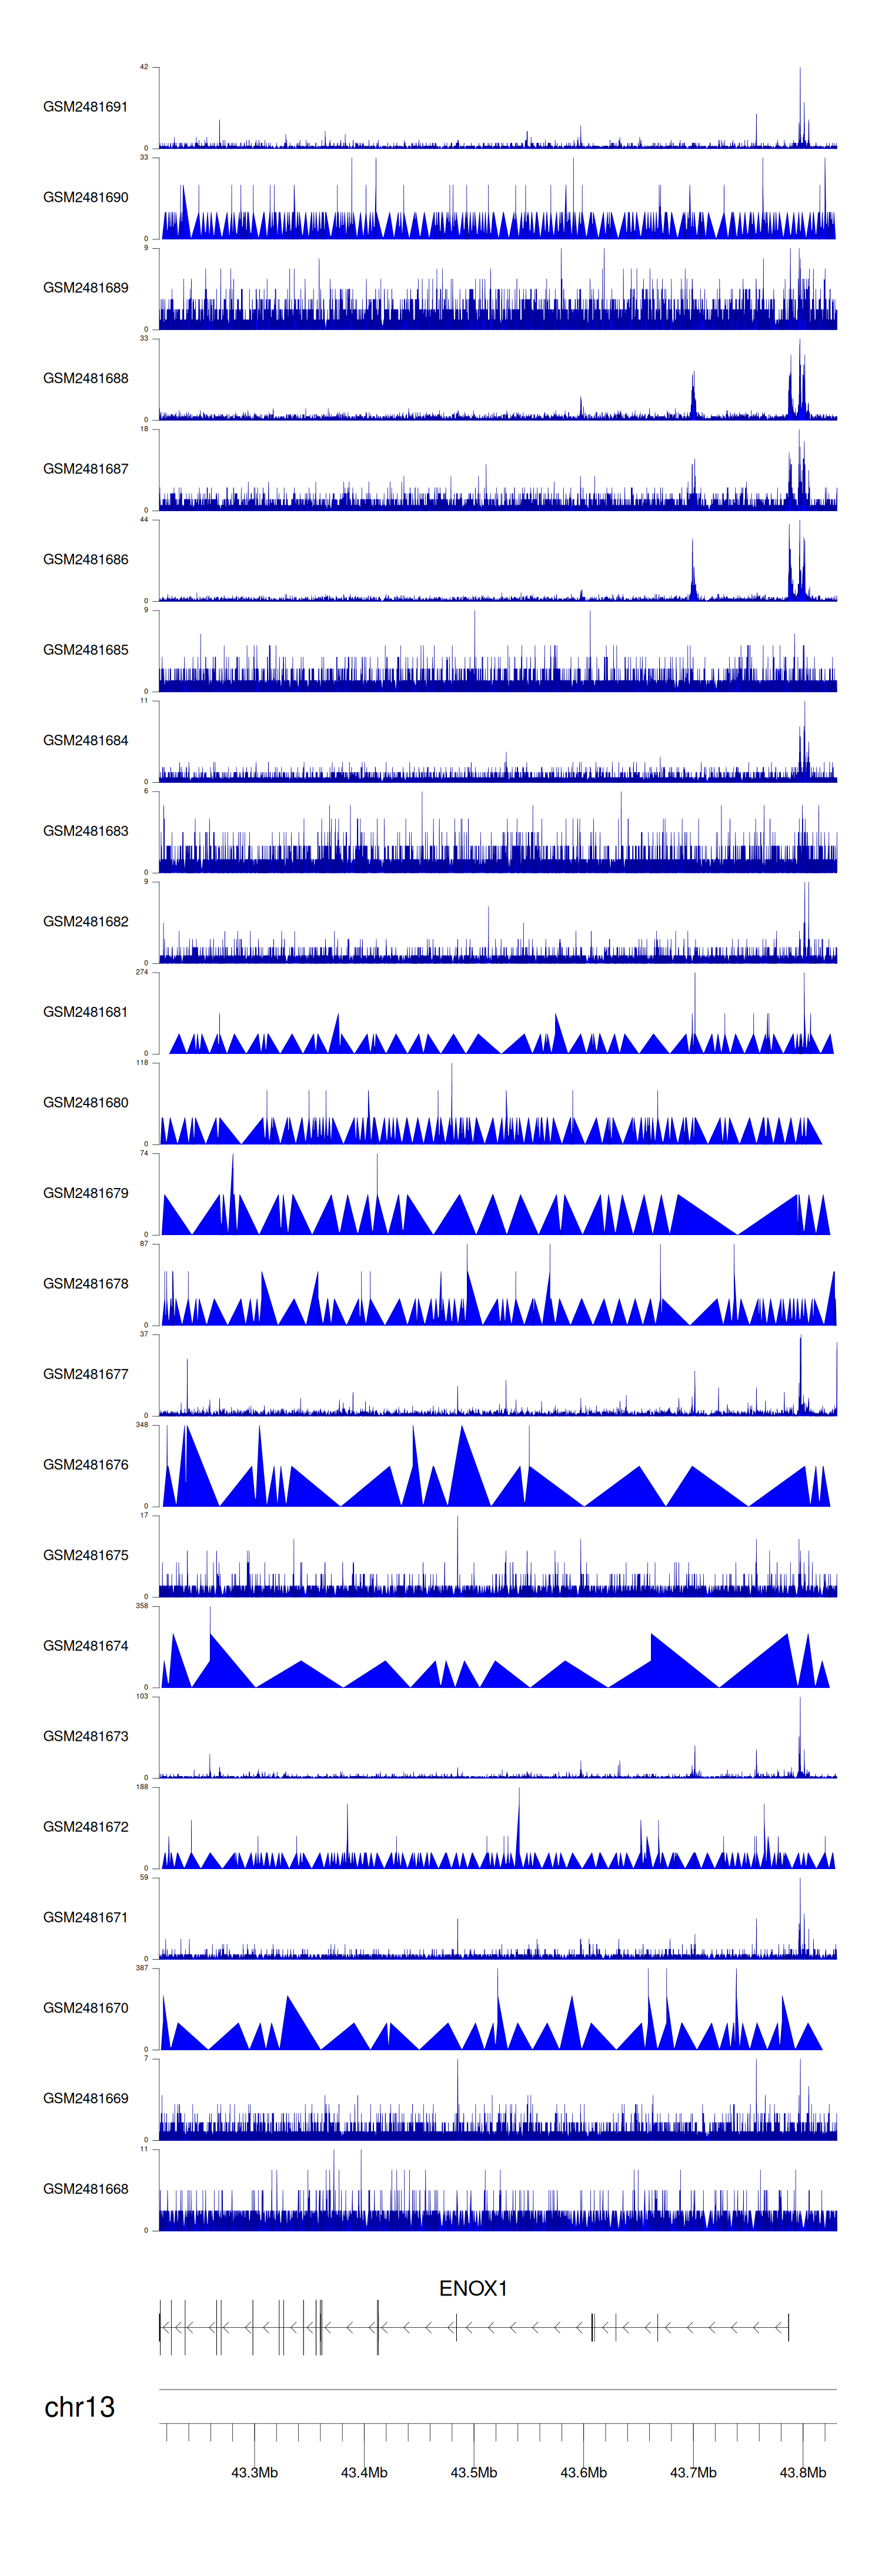
> Dataset: GSE94732 - ENOX1 peak across samples
|
Peak Plot
|
|
|
