Gene Information
|
Gene Name
|
ERLIN1 |
|
Gene ID
|
10613
|
|
Gene Full Name
|
ER lipid raft associated 1 |
|
Gene Alias
|
C10orf69|Erlin-1|KE04|KEO4|SPFH1|SPG62 |
|
Transcripts
|
ENSG00000107566
|
|
Virus
|
HTLV1 |
|
Gene Type
|
protein-coding |
|
HPA Location Info
|
Endoplasmic reticulum; 
|
|
Membrane Info
|
Disease related genes, Human disease related genes, Potential drug targets, Predicted intracellular proteins, Transporters |
|
Uniport_ID
|
O75477
|
|
HGNC ID
|
HGNC:16947
|
|
OMIM ID
|
611604 |
|
Summary
|
The protein encoded by this gene is part of a protein complex that mediates degradation of inositol 1,4,5-trisphosphate receptors in the endoplasmic reticulum. The encoded protein also binds cholesterol and regulates the SREBP signaling pathway, which promotes cellular cholesterol homeostasis. Defects in this gene have been associated with spastic paraplegia 62. [provided by RefSeq, Dec 2016] |
Target gene [ERLIN1] related to VISs 
Integration Table: if previous studies reported that target gene was altered by virus integration events, the overlap between VISs in this literature and Cistrome factors was listed in this section
| DVID |
Chromosome |
HM |
TFBS |
CA |
Sum of Overlapped Records |
Detail |
| 6003816 |
chr10 |
131 |
7 |
2 |
140 |
View |
| 6032902 |
chr10 |
0 |
0 |
0 |
0 |
View |
Target gene [ERLIN1] related to Omics data
| Data ID |
Experiment type |
Sample number |
Platform |
|
GSE189602
|
Methylation profiling (Array) |
4 |
Infinium MethylationEPIC |
|
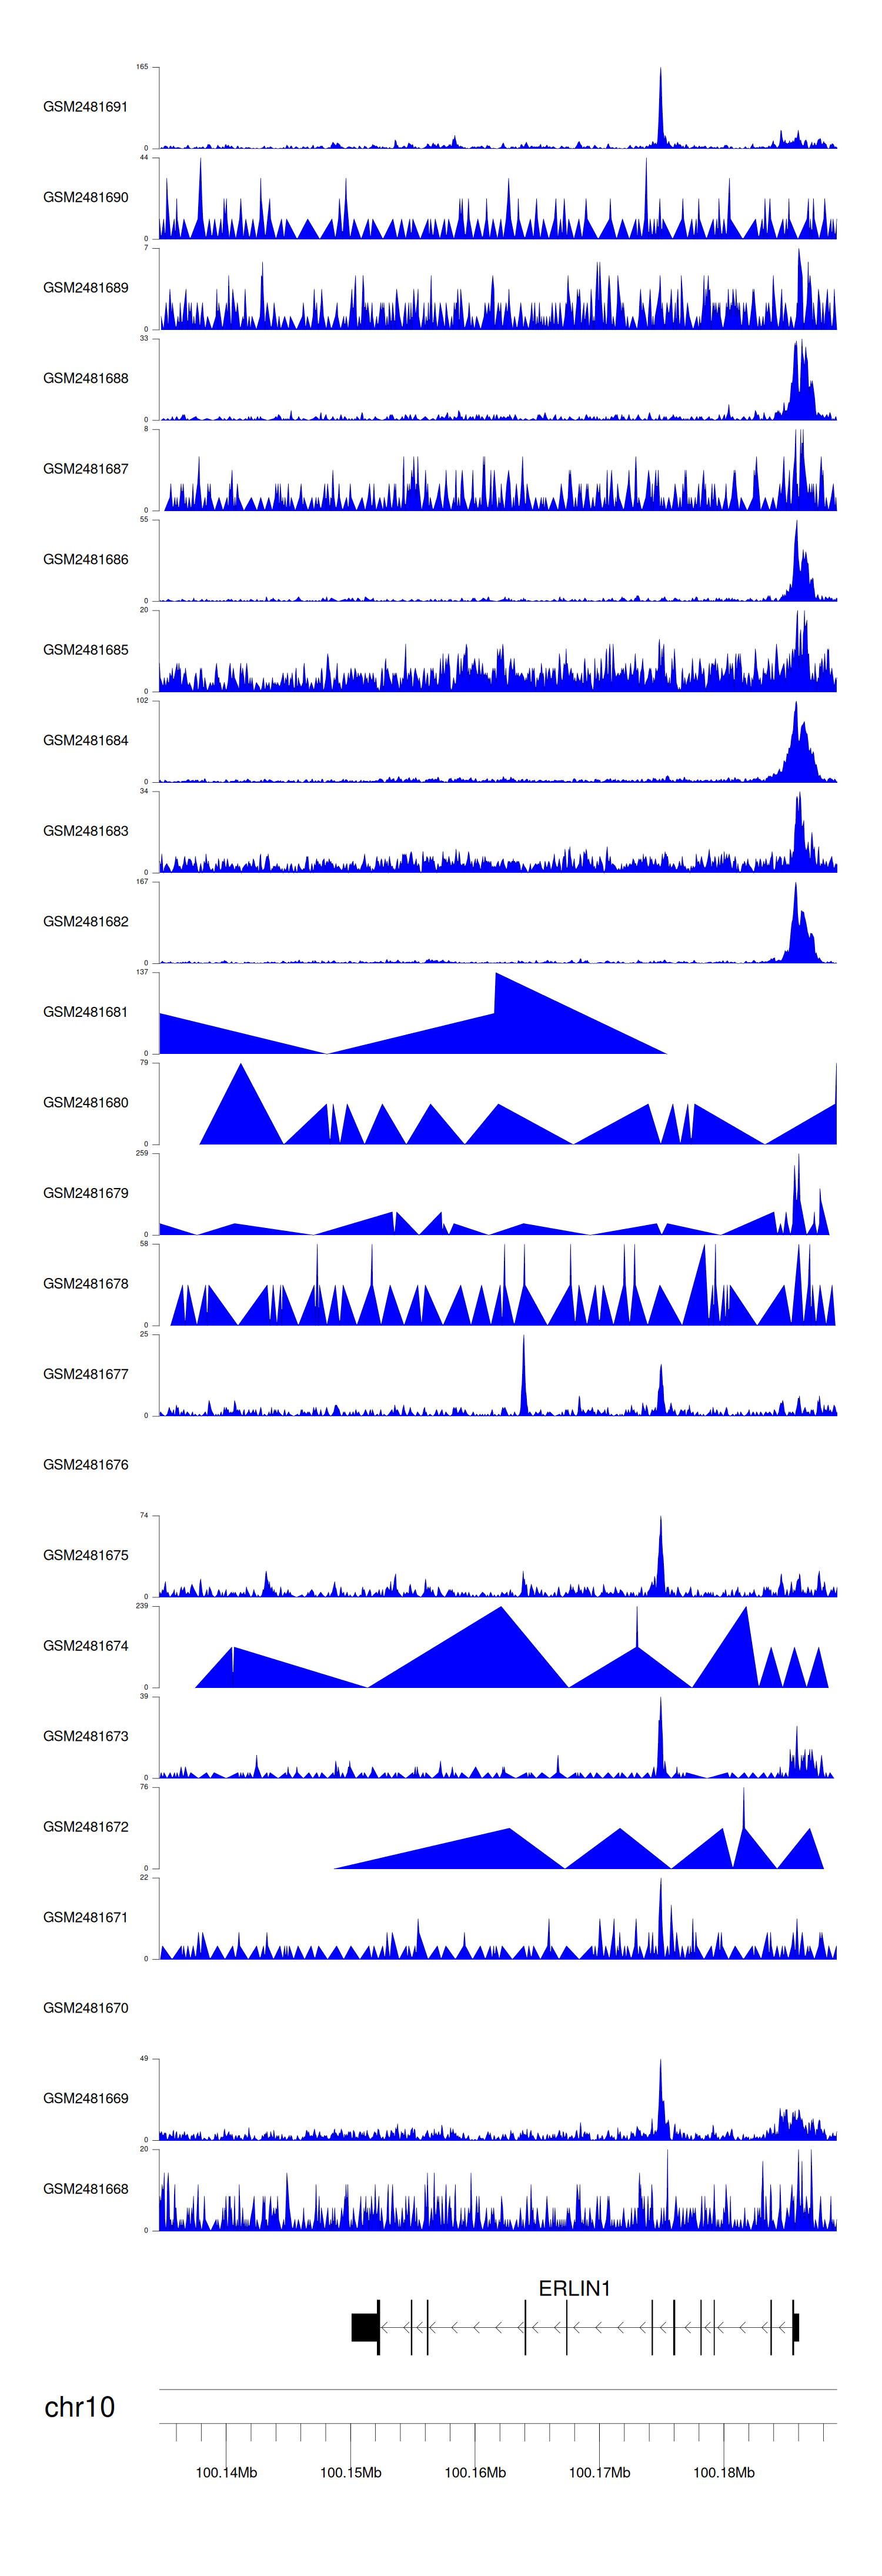
C GSE94732
|
Chip-seq |
24 |
Illumina NextSeq 500 (Homo sapiens);illumina Genome Analyzer IIx (Homo sapiens) |
|
GSE52244
|
Expression array |
15 |
[HuEx-1_0-st] Affymetrix Human Exon 1.0 ST Array [probe set (exon) version] |
|
GSE10789
|
Expression array |
6 |
NCI/ATC Hs-OperonV3 |
|
GSE224047
|
RNA-seq |
10 |
Illumina NextSeq 500 (Homo sapiens) |
|
GSE168557
|
Expression array |
6 |
Agilent-039494 SurePrint G3 Human GE v2 8x60K Microarray 039381 (Feature Number version) |
|
GSE136189
|
Methylation profiling (Array) |
40 |
Illumina HumanMethylation450 BeadChip (HumanMethylation450_15017482);Illumina Infinium HumanMethylation850 BeadChip |
When the gene can detect a peak in the dataset, a peak plot will be displayed.
> Dataset: GSE94732 - ERLIN1 peak across samples
|
Peak Plot
|
|
|
