Gene Information
|
Gene Name
|
ETFA |
|
Gene ID
|
2108
|
|
Gene Full Name
|
electron transfer flavoprotein subunit alpha |
|
Gene Alias
|
EMA|GA2|MADD |
|
Transcripts
|
ENSG00000140374
|
|
Virus
|
HTLV1 |
|
Gene Type
|
protein-coding |
|
HPA Location Info
|
Mitochondria; 
|
|
Membrane Info
|
Disease related genes, Human disease related genes, Metabolic proteins, Plasma proteins, Predicted intracellular proteins |
|
Uniport_ID
|
P13804
|
|
HGNC ID
|
HGNC:3481
|
|
OMIM ID
|
608053 |
|
Summary
|
ETFA participates in catalyzing the initial step of the mitochondrial fatty acid beta-oxidation. It shuttles electrons between primary flavoprotein dehydrogenases and the membrane-bound electron transfer flavoprotein ubiquinone oxidoreductase. Defects in electron-transfer-flavoprotein have been implicated in type II glutaricaciduria in which multiple acyl-CoA dehydrogenase deficiencies result in large excretion of glutaric, lactic, ethylmalonic, butyric, isobutyric, 2-methyl-butyric, and isovaleric acids. Two transcript variants encoding different isoforms have been found for this gene. [provided by RefSeq, Jul 2008] |
Target gene [ETFA] related to VISs 
Integration Table: if previous studies reported that target gene was altered by virus integration events, the overlap between VISs in this literature and Cistrome factors was listed in this section
| DVID |
Chromosome |
HM |
TFBS |
CA |
Sum of Overlapped Records |
Detail |
| 6007807 |
chr15 |
30 |
19 |
2 |
51 |
View |
| 6011366 |
chr15 |
7 |
7 |
13 |
27 |
View |
Target gene [ETFA] related to Omics data
| Data ID |
Experiment type |
Sample number |
Platform |
|
GSE189602
|
Methylation profiling (Array) |
4 |
Infinium MethylationEPIC |
|
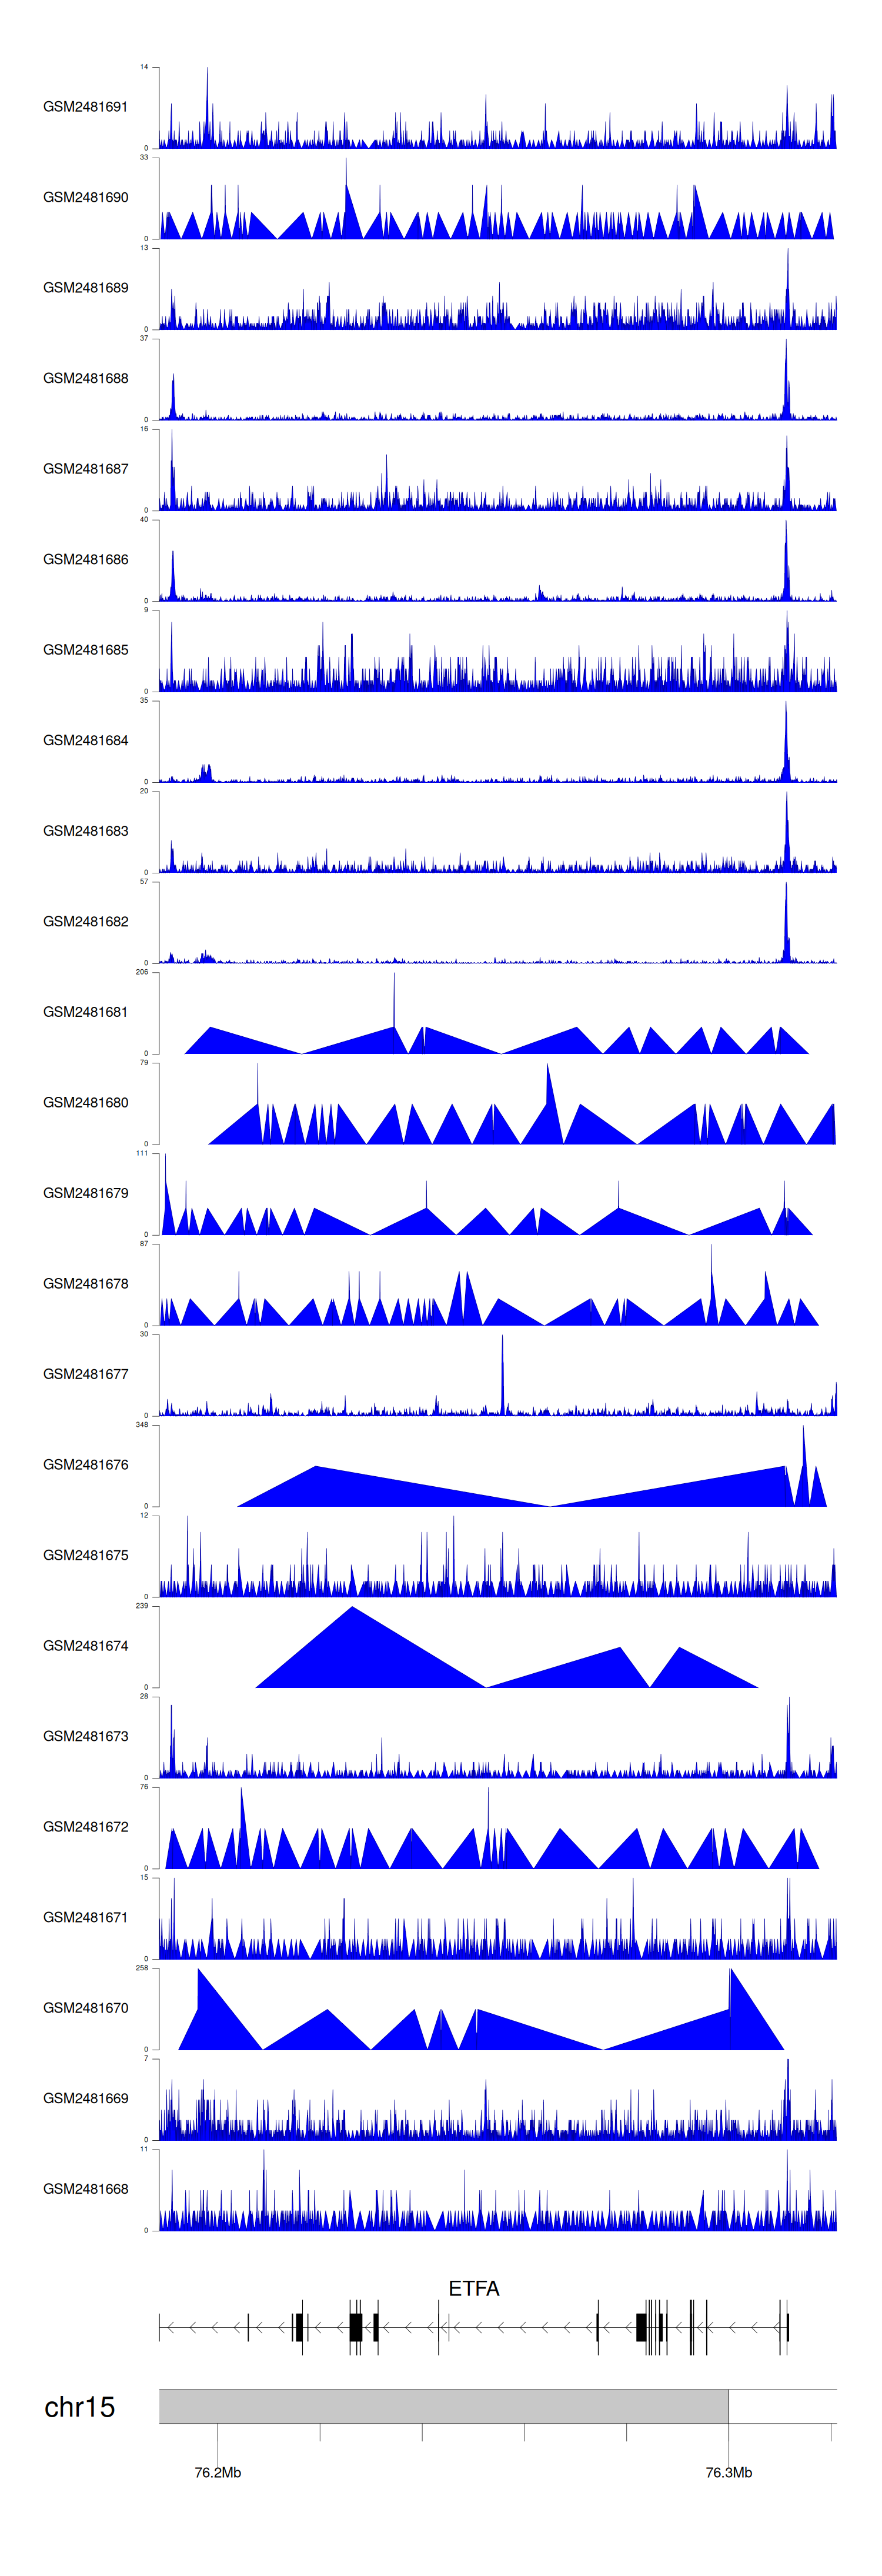
C GSE94732
|
Chip-seq |
24 |
Illumina NextSeq 500 (Homo sapiens);illumina Genome Analyzer IIx (Homo sapiens) |
|
GSE52244
|
Expression array |
15 |
[HuEx-1_0-st] Affymetrix Human Exon 1.0 ST Array [probe set (exon) version] |
|
GSE10789
|
Expression array |
6 |
NCI/ATC Hs-OperonV3 |
|
GSE224047
|
RNA-seq |
10 |
Illumina NextSeq 500 (Homo sapiens) |
|
GSE168557
|
Expression array |
6 |
Agilent-039494 SurePrint G3 Human GE v2 8x60K Microarray 039381 (Feature Number version) |
|
GSE136189
|
Methylation profiling (Array) |
40 |
Illumina HumanMethylation450 BeadChip (HumanMethylation450_15017482);Illumina Infinium HumanMethylation850 BeadChip |
When the gene can detect a peak in the dataset, a peak plot will be displayed.
> Dataset: GSE94732 - ETFA peak across samples
|
Peak Plot
|
|
|
