Gene Information
|
Gene Name
|
GLIS3 |
|
Gene ID
|
169792
|
|
Gene Full Name
|
GLIS family zinc finger 3 |
|
Gene Alias
|
NDH|ZNF515 |
|
Transcripts
|
ENSG00000107249
|
|
Virus
|
HTLV1 |
|
Gene Type
|
protein-coding |
|
HPA Location Info
|
Nucleoplasm;Golgi apparatus, Primary cilium; 
|
|
Membrane Info
|
Disease related genes, Human disease related genes, Predicted intracellular proteins, Transcription factors |
|
Uniport_ID
|
Q8NEA6
|
|
HGNC ID
|
HGNC:28510
|
|
OMIM ID
|
610192 |
|
Summary
|
This gene is a member of the GLI-similar zinc finger protein family and encodes a nuclear protein with five C2H2-type zinc finger domains. This protein functions as both a repressor and activator of transcription and is specifically involved in the development of pancreatic beta cells, the thyroid, eye, liver and kidney. Mutations in this gene have been associated with neonatal diabetes and congenital hypothyroidism (NDH). Alternatively spliced variants that encode different protein isoforms have been described but the full-length nature of only two have been determined. [provided by RefSeq, Jul 2008] |
Target gene [GLIS3] related to VISs 
Integration Table: if previous studies reported that target gene was altered by virus integration events, the overlap between VISs in this literature and Cistrome factors was listed in this section
| DVID |
Chromosome |
HM |
TFBS |
CA |
Sum of Overlapped Records |
Detail |
| 6005300 |
chr9 |
61 |
28 |
2 |
91 |
View |
| 6006353 |
chr9 |
43 |
6 |
21 |
70 |
View |
| 6022529 |
chr9 |
5 |
0 |
0 |
5 |
View |
| 6029768 |
chr9 |
1 |
0 |
0 |
1 |
View |
Target gene [GLIS3] related to Omics data
| Data ID |
Experiment type |
Sample number |
Platform |
|
C GSE94732
|
Chip-seq |
24 |
Illumina NextSeq 500 (Homo sapiens);illumina Genome Analyzer IIx (Homo sapiens) |
|
GSE168557
|
Expression array |
6 |
Agilent-039494 SurePrint G3 Human GE v2 8x60K Microarray 039381 (Feature Number version) |
|
GSE52244
|
Expression array |
15 |
[HuEx-1_0-st] Affymetrix Human Exon 1.0 ST Array [probe set (exon) version] |
|
GSE10789
|
Expression array |
6 |
NCI/ATC Hs-OperonV3 |
|
GSE189602
|
Methylation profiling (Array) |
4 |
Infinium MethylationEPIC |
|
GSE136189
|
Methylation profiling (Array) |
40 |
Illumina HumanMethylation450 BeadChip (HumanMethylation450_15017482);Illumina Infinium HumanMethylation850 BeadChip |
When the gene can detect a peak in the dataset, a peak plot will be displayed.
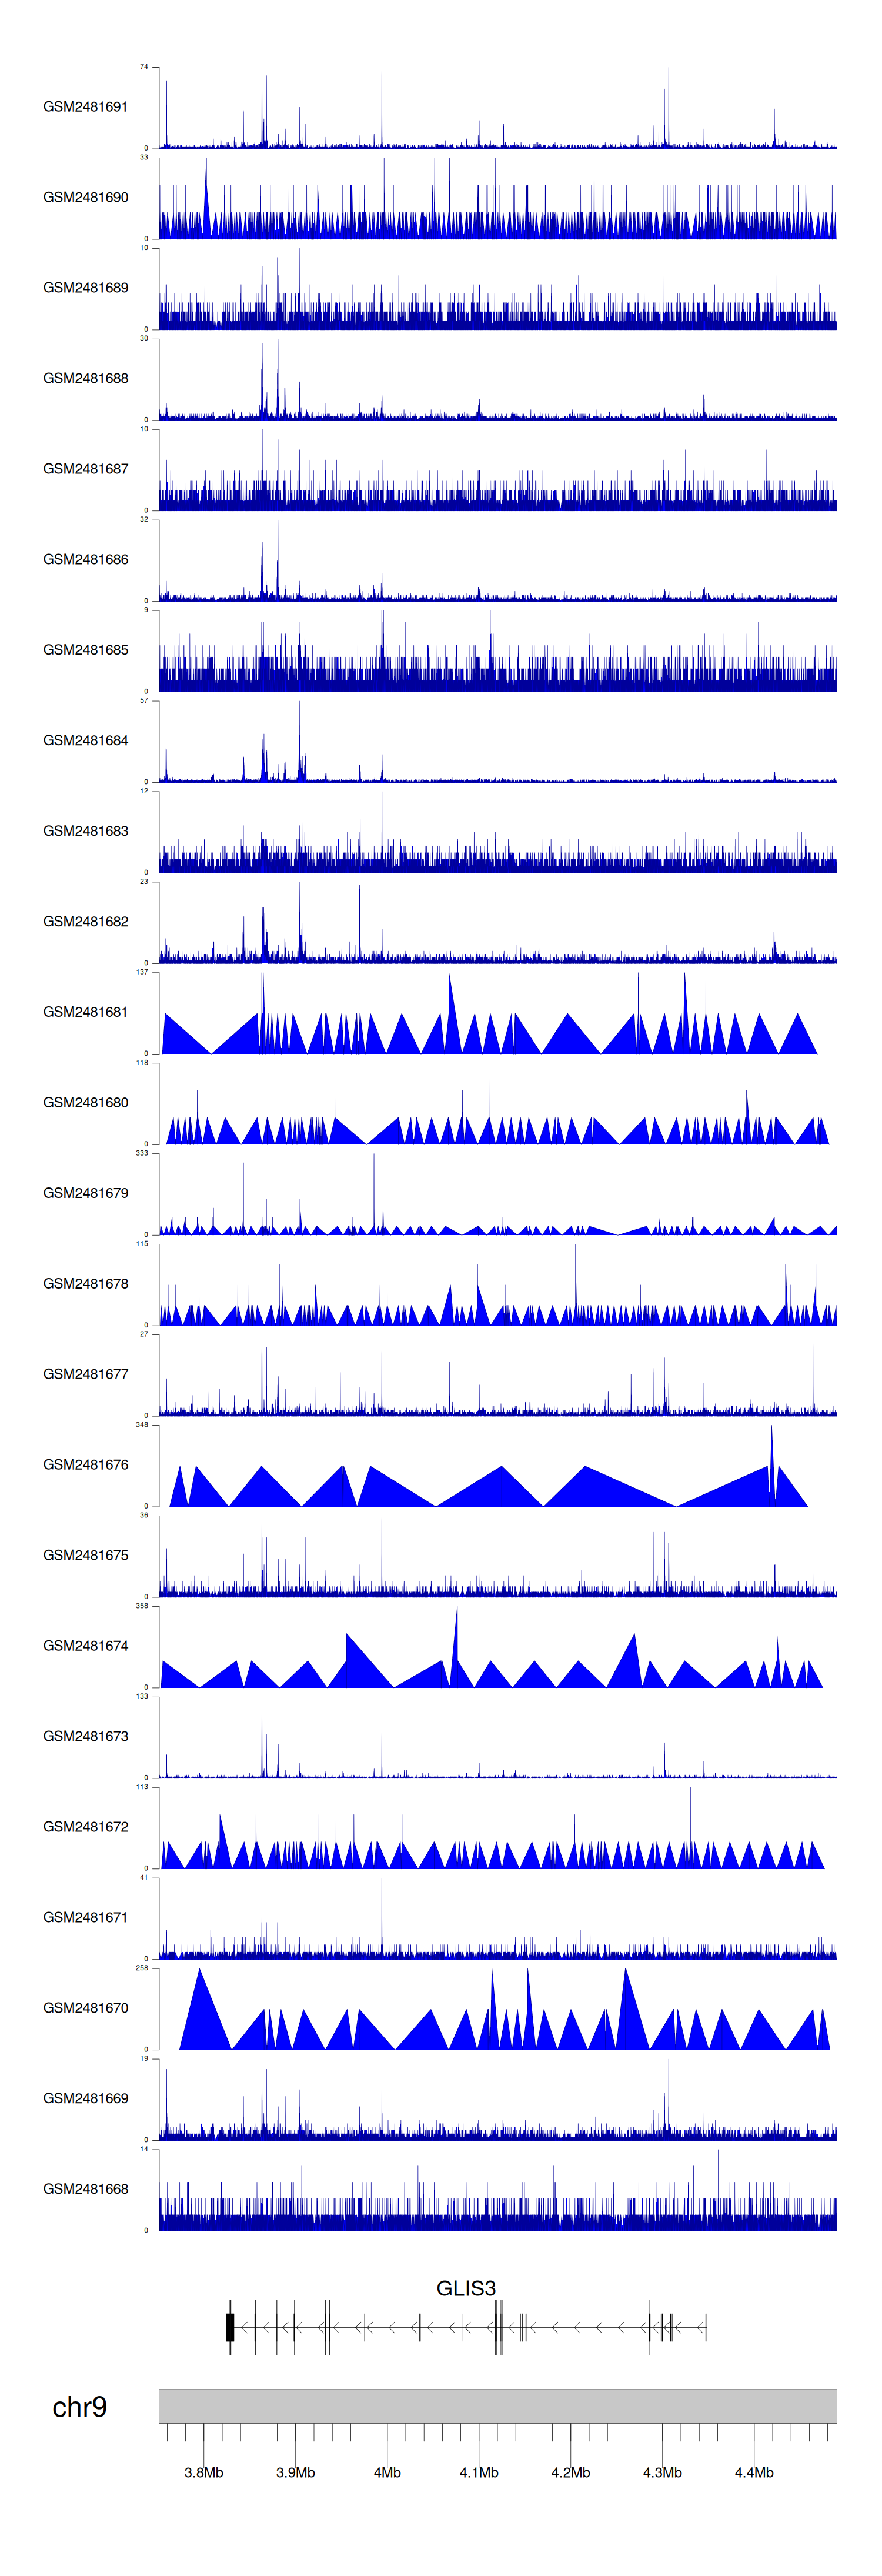
> Dataset: GSE94732 - GLIS3 peak across samples
|
Peak Plot
|
|
|
