Gene Information
|
Gene Name
|
GNB3 |
|
Gene ID
|
2784
|
|
Gene Full Name
|
G protein subunit beta 3 |
|
Gene Alias
|
CSNB1H|HG2D |
|
Transcripts
|
ENSG00000111664
|
|
Virus
|
HTLV1 |
|
Gene Type
|
protein-coding |
|
HPA Location Info
|
Plasma membrane;Golgi apparatus; 
|
|
Membrane Info
|
Disease related genes, Human disease related genes, Plasma proteins, Predicted intracellular proteins, RAS pathway related proteins |
|
Uniport_ID
|
P16520
|
|
HGNC ID
|
HGNC:4400
|
|
OMIM ID
|
139130 |
|
Summary
|
Heterotrimeric guanine nucleotide-binding proteins (G proteins), which integrate signals between receptors and effector proteins, are composed of an alpha, a beta, and a gamma subunit. These subunits are encoded by families of related genes. This gene encodes a beta subunit which belongs to the WD repeat G protein beta family. Beta subunits are important regulators of alpha subunits, as well as of certain signal transduction receptors and effectors. A single-nucleotide polymorphism (C825T) in this gene is associated with essential hypertension and obesity. This polymorphism is also associated with the occurrence of the splice variant GNB3-s, which appears to have increased activity. GNB3-s is an example of alternative splicing caused by a nucleotide change outside of the splice donor and acceptor sites. Alternative splicing results in multiple transcript variants. Additional alternatively spliced transcript variants of this gene have been described, but their full-length nature is not known. [provided by RefSeq, Jul 2014] |
Target gene [GNB3] related to VISs 
Integration Table: if previous studies reported that target gene was altered by virus integration events, the overlap between VISs in this literature and Cistrome factors was listed in this section
| DVID |
Chromosome |
HM |
TFBS |
CA |
Sum of Overlapped Records |
Detail |
| 6014677 |
chr12 |
11 |
5 |
0 |
16 |
View |
Target gene [GNB3] related to Omics data
| Data ID |
Experiment type |
Sample number |
Platform |
|
C GSE94732
|
Chip-seq |
24 |
Illumina NextSeq 500 (Homo sapiens);illumina Genome Analyzer IIx (Homo sapiens) |
|
GSE168557
|
Expression array |
6 |
Agilent-039494 SurePrint G3 Human GE v2 8x60K Microarray 039381 (Feature Number version) |
|
GSE52244
|
Expression array |
15 |
[HuEx-1_0-st] Affymetrix Human Exon 1.0 ST Array [probe set (exon) version] |
|
GSE10789
|
Expression array |
6 |
NCI/ATC Hs-OperonV3 |
|
GSE189602
|
Methylation profiling (Array) |
4 |
Infinium MethylationEPIC |
|
GSE136189
|
Methylation profiling (Array) |
40 |
Illumina HumanMethylation450 BeadChip (HumanMethylation450_15017482);Illumina Infinium HumanMethylation850 BeadChip |
When the gene can detect a peak in the dataset, a peak plot will be displayed.
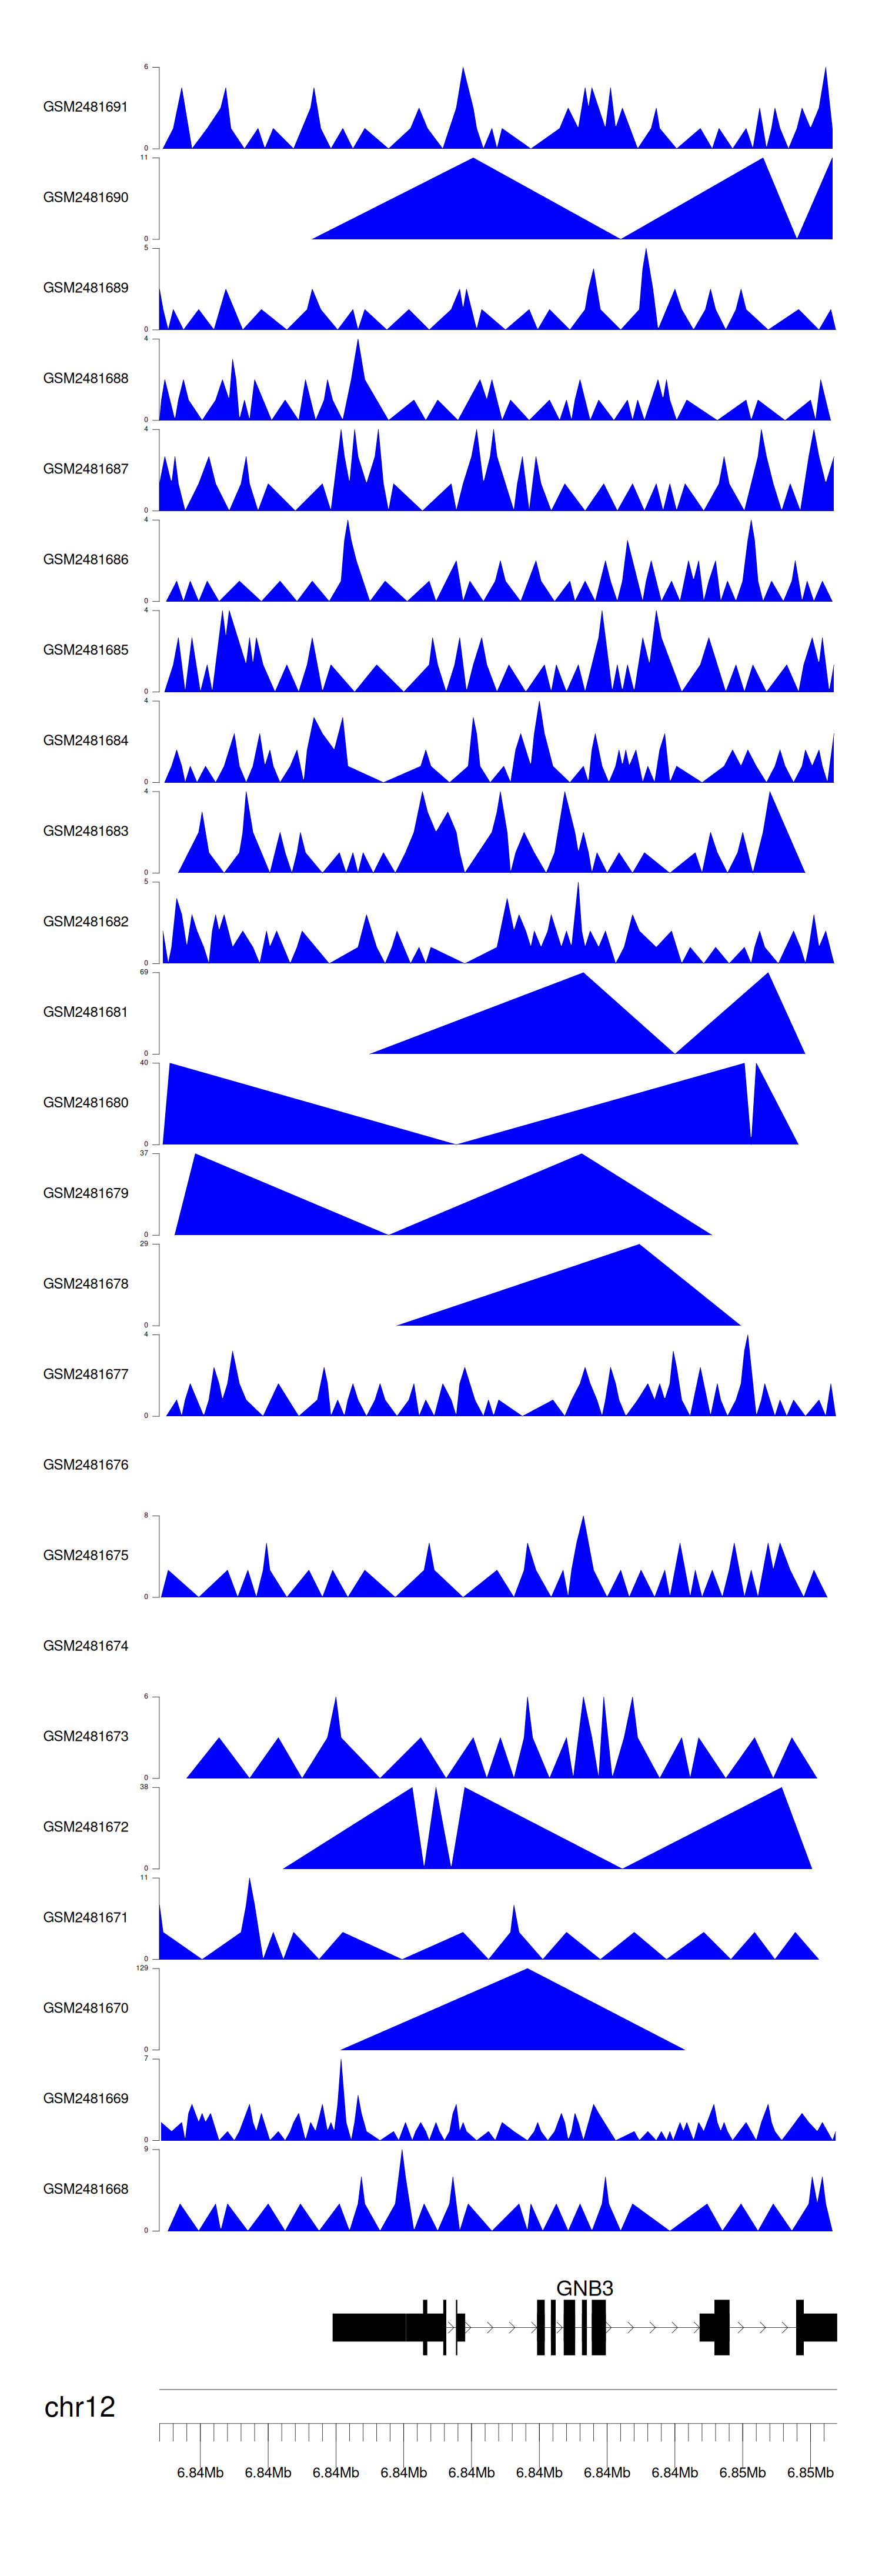
> Dataset: GSE94732 - GNB3 peak across samples
|
Peak Plot
|
|
|
