Gene Information
|
Gene Name
|
HLCS |
|
Gene ID
|
3141
|
|
Gene Full Name
|
holocarboxylase synthetase |
|
Gene Alias
|
HCS |
|
Transcripts
|
ENSG00000159267
|
|
Virus
|
HTLV1 |
|
Gene Type
|
protein-coding |
|
HPA Location Info
|
Cytosol; 
|
|
Membrane Info
|
Disease related genes, Enzymes, Human disease related genes, Metabolic proteins, Potential drug targets, Predicted intracellular proteins |
|
Uniport_ID
|
P50747
|
|
HGNC ID
|
HGNC:4976
|
|
OMIM ID
|
609018 |
|
Summary
|
This gene encodes an enzyme that catalyzes the binding of biotin to carboxylases and histones. The protein plays an important role in gluconeogenesis, fatty acid synthesis and branched chain amino acid catabolism. Defects in this gene are the cause of holocarboxylase synthetase deficiency. Multiple alternatively spliced variants, encoding the same protein, have been identified.[provided by RefSeq, Jun 2011] |
Target gene [HLCS] related to VISs 
Integration Table: if previous studies reported that target gene was altered by virus integration events, the overlap between VISs in this literature and Cistrome factors was listed in this section
| DVID |
Chromosome |
HM |
TFBS |
CA |
Sum of Overlapped Records |
Detail |
| 6016801 |
chr21 |
8 |
2 |
0 |
10 |
View |
| 6019054 |
chr21 |
0 |
8 |
0 |
8 |
View |
| 6023580 |
chr21 |
3 |
1 |
0 |
4 |
View |
| 6028371 |
chr21 |
1 |
0 |
0 |
1 |
View |
Target gene [HLCS] related to Omics data
| Data ID |
Experiment type |
Sample number |
Platform |
|
GSE189602
|
Methylation profiling (Array) |
4 |
Infinium MethylationEPIC |
|
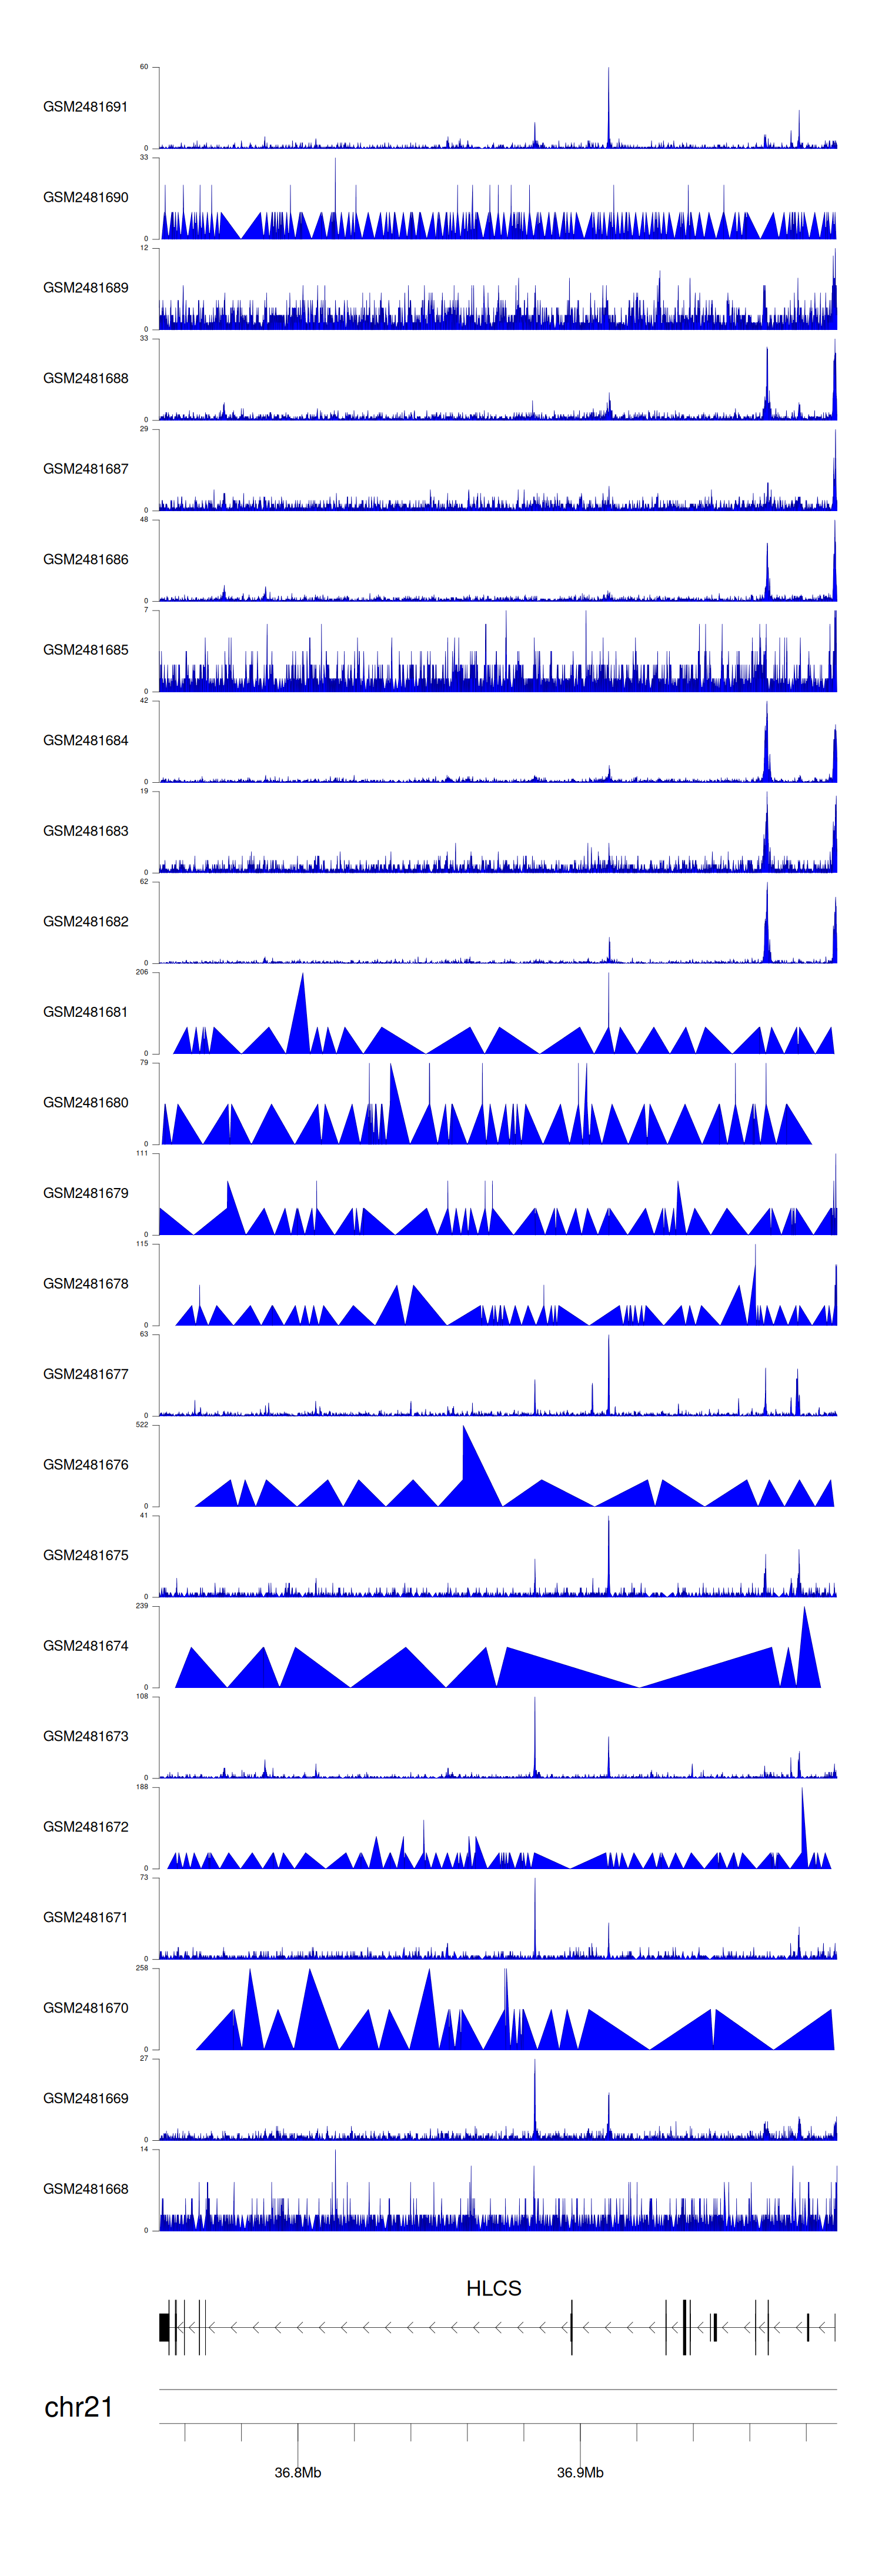
C GSE94732
|
Chip-seq |
24 |
Illumina NextSeq 500 (Homo sapiens);illumina Genome Analyzer IIx (Homo sapiens) |
|
GSE52244
|
Expression array |
15 |
[HuEx-1_0-st] Affymetrix Human Exon 1.0 ST Array [probe set (exon) version] |
|
GSE10789
|
Expression array |
6 |
NCI/ATC Hs-OperonV3 |
|
GSE224047
|
RNA-seq |
10 |
Illumina NextSeq 500 (Homo sapiens) |
|
GSE168557
|
Expression array |
6 |
Agilent-039494 SurePrint G3 Human GE v2 8x60K Microarray 039381 (Feature Number version) |
|
GSE136189
|
Methylation profiling (Array) |
40 |
Illumina HumanMethylation450 BeadChip (HumanMethylation450_15017482);Illumina Infinium HumanMethylation850 BeadChip |
When the gene can detect a peak in the dataset, a peak plot will be displayed.
> Dataset: GSE94732 - HLCS peak across samples
|
Peak Plot
|
|
|
