Gene Information
|
Gene Name
|
IFT43 |
|
Gene ID
|
112752
|
|
Gene Full Name
|
intraflagellar transport 43 |
|
Gene Alias
|
C14orf179|CED3|RP81|SRTD18 |
|
Transcripts
|
ENSG00000119650
|
|
Virus
|
HTLV1 |
|
Gene Type
|
protein-coding |
|
HPA Location Info
|
Microtubules, Primary cilium, Principal piece, End piece;Cytokinetic bridge, Mitotic spindle, Centriolar satellite, Basal body, Perinuclear theca; 
|
|
Membrane Info
|
Disease related genes, Human disease related genes, Predicted intracellular proteins |
|
Uniport_ID
|
Q96FT9
|
|
HGNC ID
|
HGNC:29669
|
|
OMIM ID
|
614068 |
|
Summary
|
This gene encodes a subunit of the intraflagellar transport complex A (IFT-A). IFT-A is a multiprotein complex that plays an important role in cilia assembly and maintenance by mediating retrograde ciliary transport. Mutations in this gene are a cause of cranioectodermal dysplasia-3 (CED3), also known as Sensenbrenner syndrome. Alternatively spliced transcript variants encoding multiple isoforms have been observed for this gene. [provided by RefSeq, Dec 2011] |
Target gene [IFT43] related to VISs 
Integration Table: if previous studies reported that target gene was altered by virus integration events, the overlap between VISs in this literature and Cistrome factors was listed in this section
| DVID |
Chromosome |
HM |
TFBS |
CA |
Sum of Overlapped Records |
Detail |
| 6024198 |
chr14 |
3 |
0 |
0 |
3 |
View |
Target gene [IFT43] related to Omics data
| Data ID |
Experiment type |
Sample number |
Platform |
|
GSE189602
|
Methylation profiling (Array) |
4 |
Infinium MethylationEPIC |
|
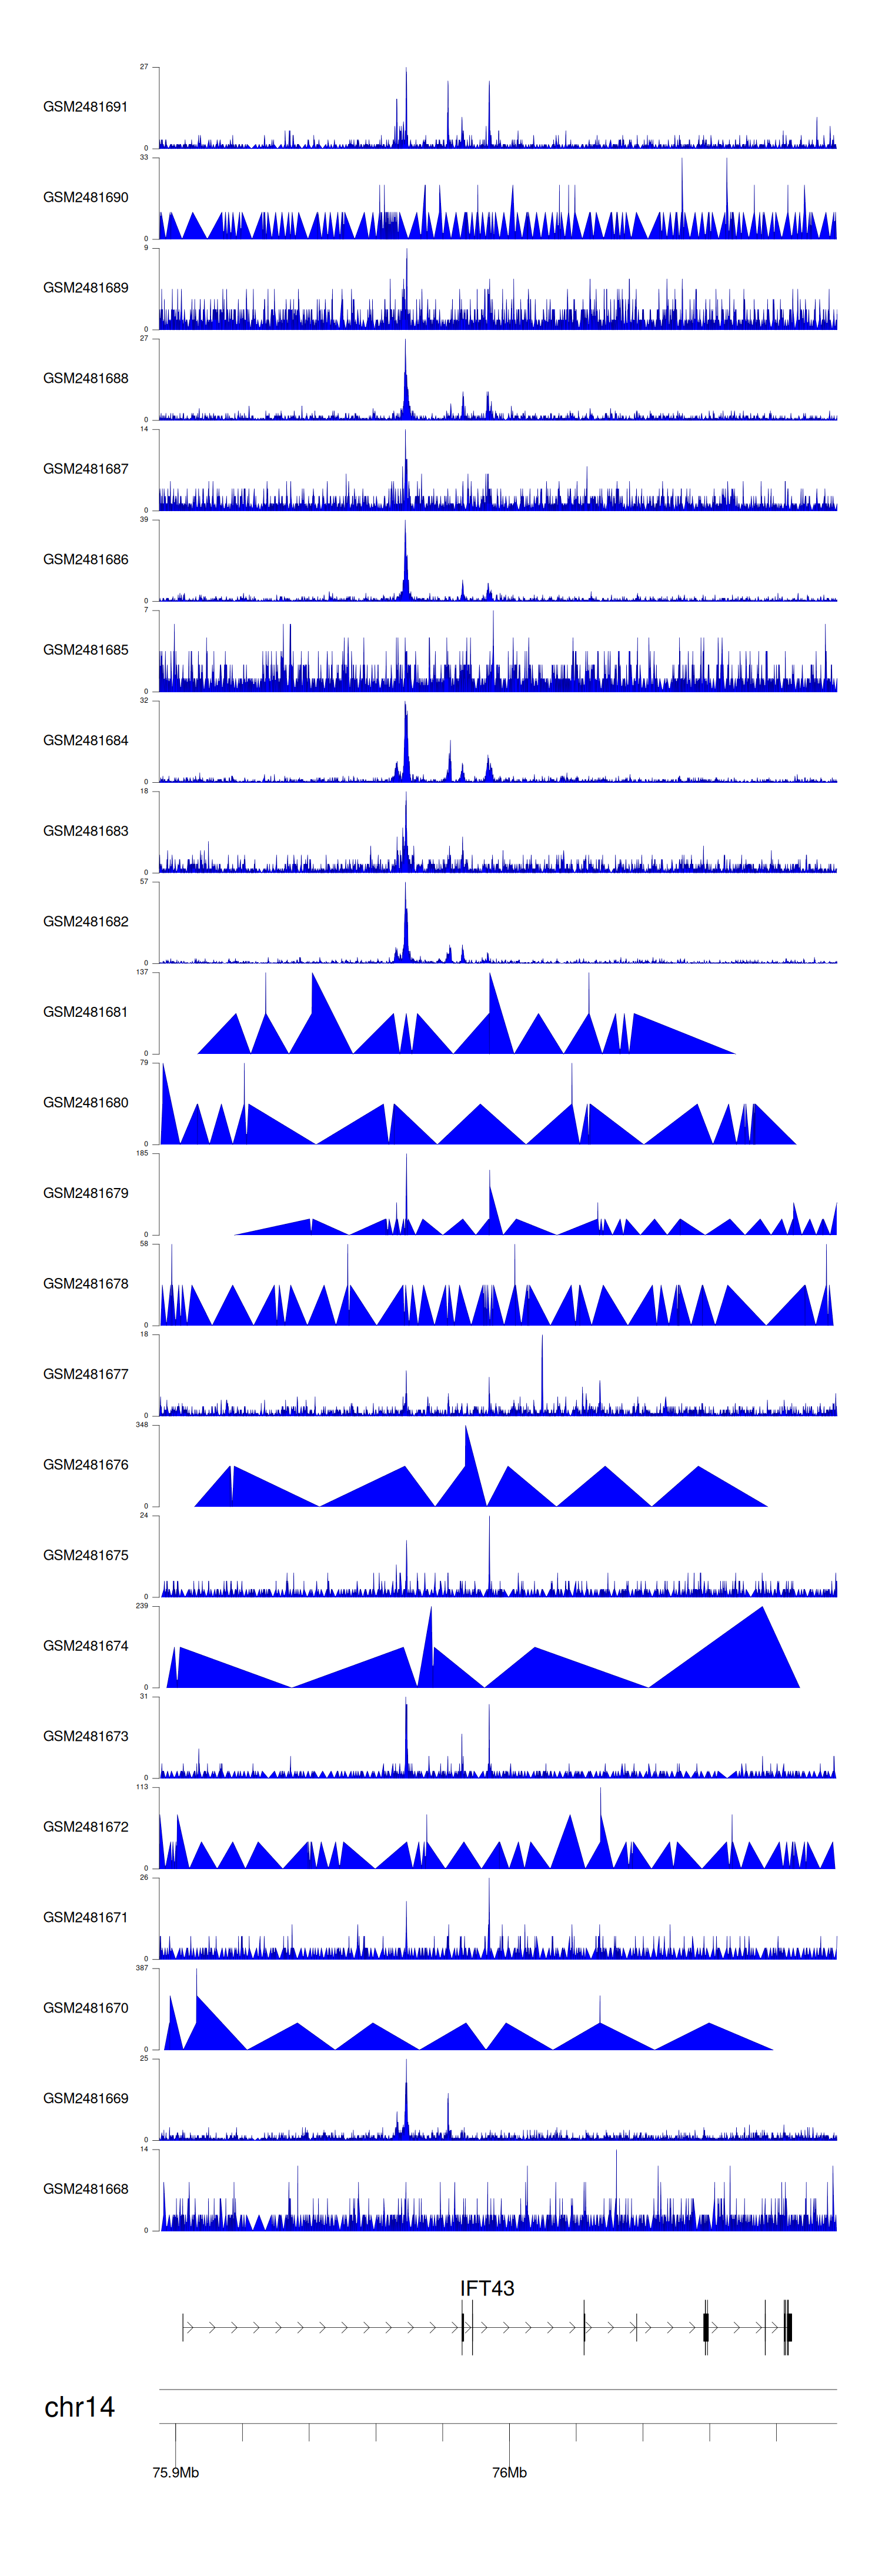
C GSE94732
|
Chip-seq |
24 |
Illumina NextSeq 500 (Homo sapiens);illumina Genome Analyzer IIx (Homo sapiens) |
|
GSE52244
|
Expression array |
15 |
[HuEx-1_0-st] Affymetrix Human Exon 1.0 ST Array [probe set (exon) version] |
|
GSE10789
|
Expression array |
6 |
NCI/ATC Hs-OperonV3 |
|
GSE224047
|
RNA-seq |
10 |
Illumina NextSeq 500 (Homo sapiens) |
|
GSE168557
|
Expression array |
6 |
Agilent-039494 SurePrint G3 Human GE v2 8x60K Microarray 039381 (Feature Number version) |
When the gene can detect a peak in the dataset, a peak plot will be displayed.
> Dataset: GSE94732 - IFT43 peak across samples
|
Peak Plot
|
|
|
