Gene Information
|
Gene Name
|
IMPG1 |
|
Gene ID
|
3617
|
|
Gene Full Name
|
interphotoreceptor matrix proteoglycan 1 |
|
Gene Alias
|
GP147|IPM150|RP91|SPACR|VMD4 |
|
Transcripts
|
ENSG00000112706
|
|
Virus
|
HTLV1 |
|
Gene Type
|
protein-coding |
|
HPA Location Info
|
Plasma membrane, Microtubules, Mid piece, Principal piece, End piece;Secreted in other tissues; 
|
|
Membrane Info
|
Disease related genes, Human disease related genes, Predicted intracellular proteins, Predicted secreted proteins |
|
Uniport_ID
|
Q17R60
|
|
HGNC ID
|
HGNC:6055
|
|
OMIM ID
|
602870 |
|
Summary
|
This gene encodes a protein that is a major component of the retinal interphotoreceptor matrix. The encoded protein is a proteoglycan that is thought to play a role in maintaining viability of photoreceptor cells and in adhesion of the neural retina to the retinal pigment epithelium. Alternate splicing results in multiple transcript variants. [provided by RefSeq, Sep 2013] |
Target gene [IMPG1] related to VISs 
Integration Table: if previous studies reported that target gene was altered by virus integration events, the overlap between VISs in this literature and Cistrome factors was listed in this section
| DVID |
Chromosome |
HM |
TFBS |
CA |
Sum of Overlapped Records |
Detail |
| 6008553 |
chr6 |
40 |
4 |
0 |
44 |
View |
| 6021494 |
chr6 |
6 |
0 |
0 |
6 |
View |
| 6025875 |
chr6 |
2 |
0 |
0 |
2 |
View |
| 6032231 |
chr6 |
0 |
0 |
0 |
0 |
View |
Target gene [IMPG1] related to Omics data
| Data ID |
Experiment type |
Sample number |
Platform |
|
C GSE94732
|
Chip-seq |
24 |
Illumina NextSeq 500 (Homo sapiens);illumina Genome Analyzer IIx (Homo sapiens) |
|
GSE168557
|
Expression array |
6 |
Agilent-039494 SurePrint G3 Human GE v2 8x60K Microarray 039381 (Feature Number version) |
|
GSE52244
|
Expression array |
15 |
[HuEx-1_0-st] Affymetrix Human Exon 1.0 ST Array [probe set (exon) version] |
|
GSE10789
|
Expression array |
6 |
NCI/ATC Hs-OperonV3 |
|
GSE189602
|
Methylation profiling (Array) |
4 |
Infinium MethylationEPIC |
|
GSE136189
|
Methylation profiling (Array) |
40 |
Illumina HumanMethylation450 BeadChip (HumanMethylation450_15017482);Illumina Infinium HumanMethylation850 BeadChip |
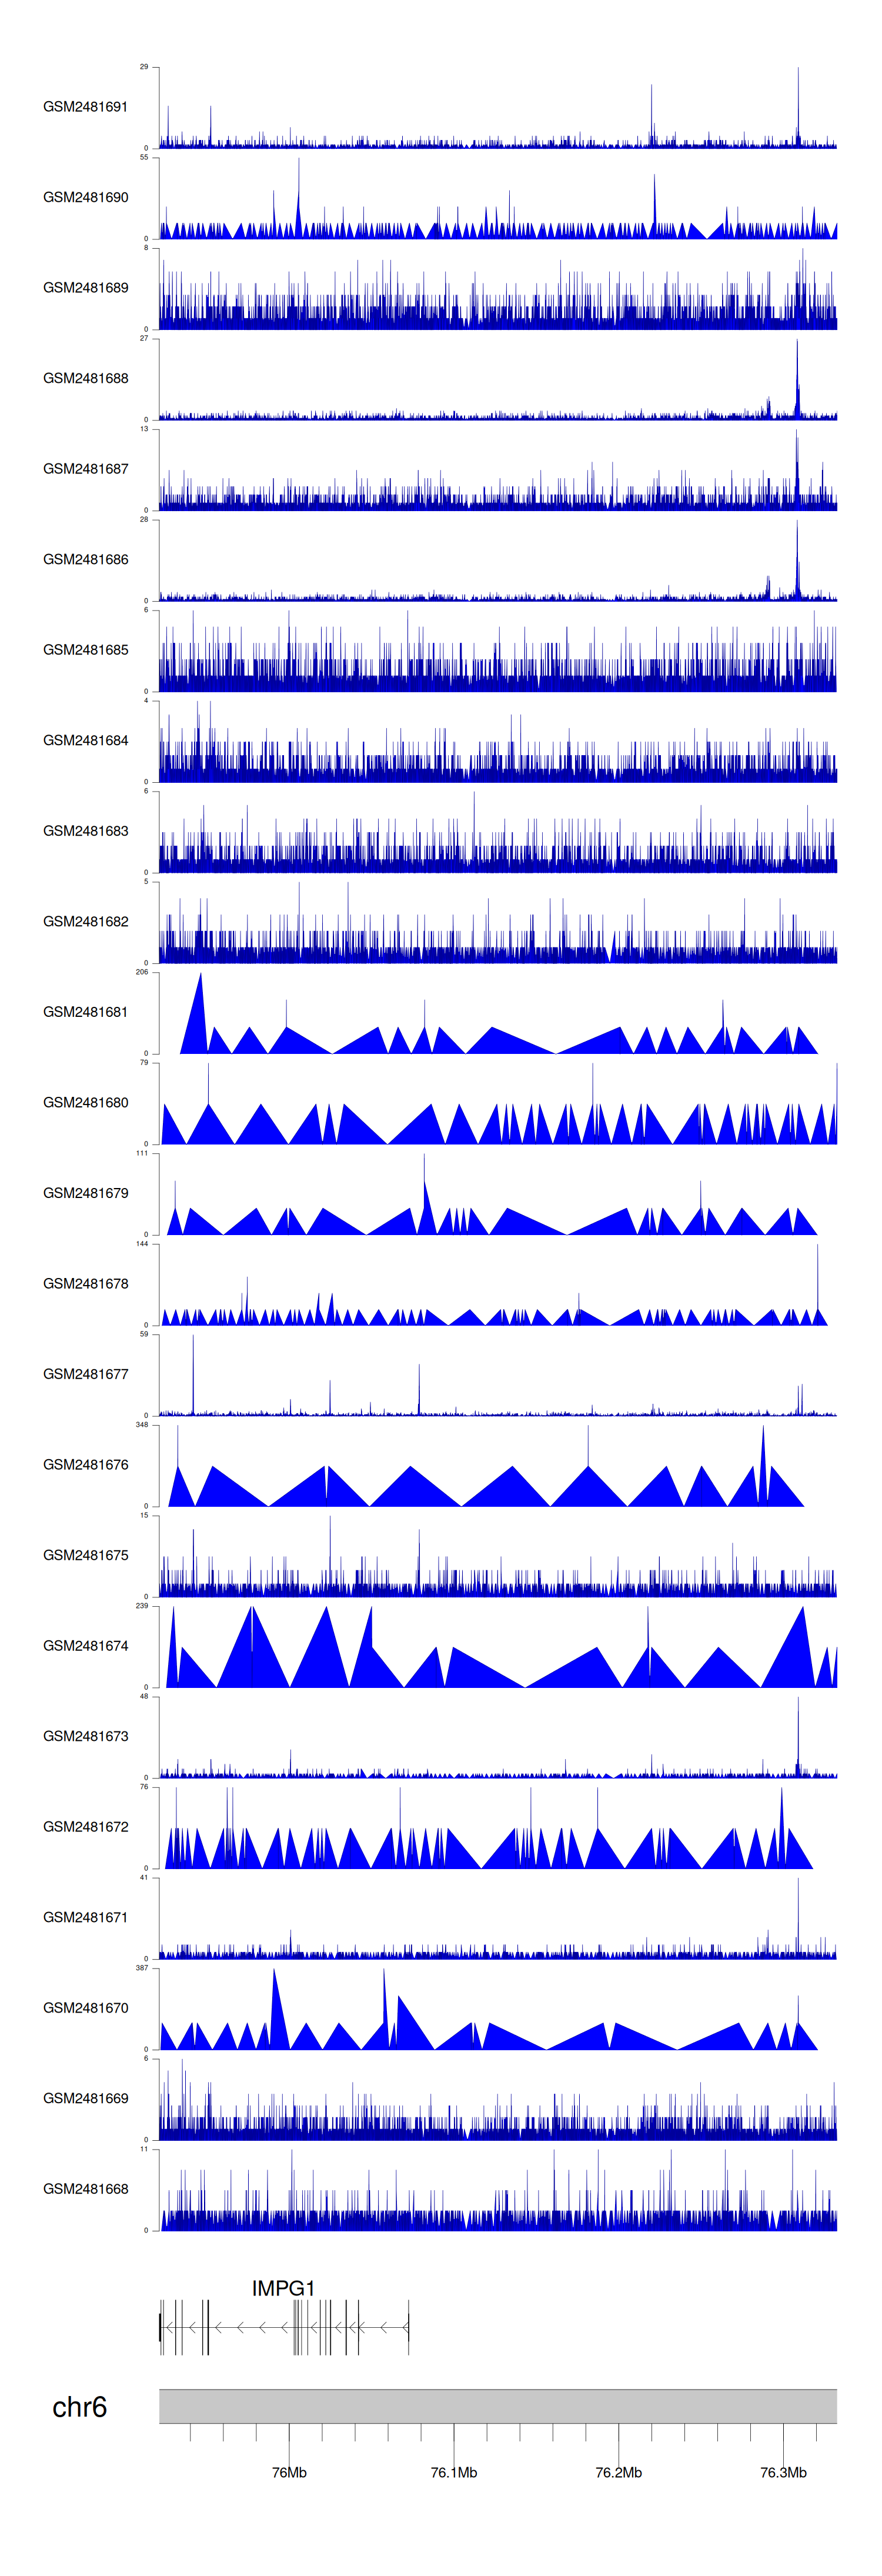
When the gene can detect a peak in the dataset, a peak plot will be displayed.
> Dataset: GSE94732 - IMPG1 peak across samples
|
Peak Plot
|
|
|
