Gene Information
|
Gene Name
|
IPPK |
|
Gene ID
|
64768
|
|
Gene Full Name
|
inositol-pentakisphosphate 2-kinase |
|
Gene Alias
|
C9orf12|INSP5K2|IP5K|IPK1|bA476B13.1 |
|
Transcripts
|
ENSG00000127080
|
|
Virus
|
HTLV1 |
|
Gene Type
|
protein-coding |
|
HPA Location Info
|
Cytosol; 
|
|
Membrane Info
|
Enzymes, Metabolic proteins, Predicted intracellular proteins |
|
Uniport_ID
|
Q9H8X2
|
|
HGNC ID
|
HGNC:14645
|
|
OMIM ID
|
619043 |
|
Summary
|
The protein encoded by this gene is a kinase that phosphorylates position 2 of inositol-1,3,4,5,6-pentakisphosphate to form inositol-1,2,3,4,5,6-hexakisphosphate (InsP6). InsP6 has a variety of functions, including stimulation of DNA repair, endocytosis, and mRNA export. [provided by RefSeq, Nov 2010] |
Target gene [IPPK] related to VISs 
Integration Table: if previous studies reported that target gene was altered by virus integration events, the overlap between VISs in this literature and Cistrome factors was listed in this section
| DVID |
Chromosome |
HM |
TFBS |
CA |
Sum of Overlapped Records |
Detail |
| 6000476 |
chr9 |
130 |
863 |
479 |
1472 |
View |
Target gene [IPPK] related to Omics data
| Data ID |
Experiment type |
Sample number |
Platform |
|
GSE189602
|
Methylation profiling (Array) |
4 |
Infinium MethylationEPIC |
|
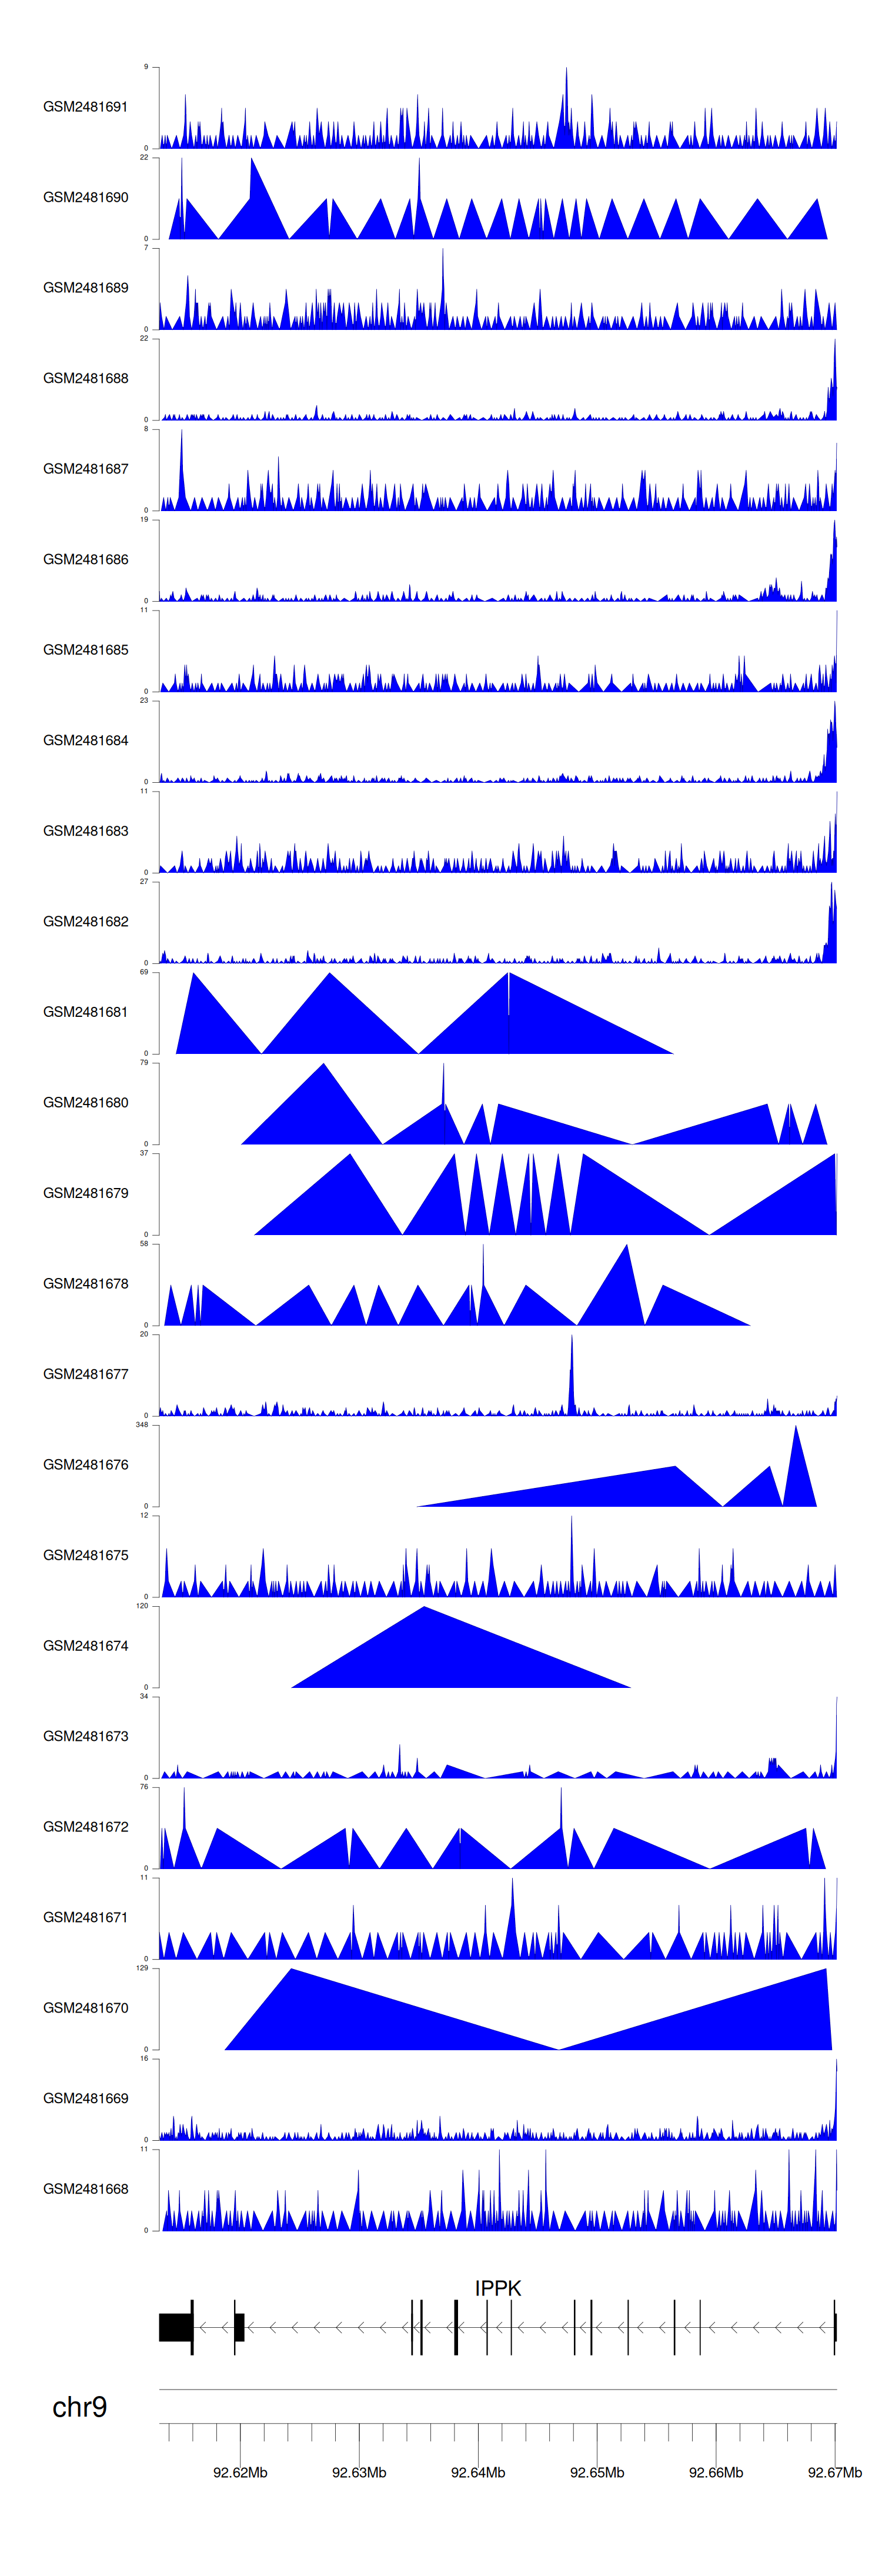
C GSE94732
|
Chip-seq |
24 |
Illumina NextSeq 500 (Homo sapiens);illumina Genome Analyzer IIx (Homo sapiens) |
|
GSE52244
|
Expression array |
15 |
[HuEx-1_0-st] Affymetrix Human Exon 1.0 ST Array [probe set (exon) version] |
|
GSE10789
|
Expression array |
6 |
NCI/ATC Hs-OperonV3 |
|
GSE224047
|
RNA-seq |
10 |
Illumina NextSeq 500 (Homo sapiens) |
|
GSE168557
|
Expression array |
6 |
Agilent-039494 SurePrint G3 Human GE v2 8x60K Microarray 039381 (Feature Number version) |
|
GSE136189
|
Methylation profiling (Array) |
40 |
Illumina HumanMethylation450 BeadChip (HumanMethylation450_15017482);Illumina Infinium HumanMethylation850 BeadChip |
When the gene can detect a peak in the dataset, a peak plot will be displayed.
> Dataset: GSE94732 - IPPK peak across samples
|
Peak Plot
|
|
|
