Gene Information
|
Gene Name
|
ITPR1 |
|
Gene ID
|
3708
|
|
Gene Full Name
|
inositol 1,4,5-trisphosphate receptor type 1 |
|
Gene Alias
|
ACV|CLA4|INSP3R1|IP3R|IP3R1|PPP1R94|SCA15|SCA16|SCA29 |
|
Transcripts
|
ENSG00000150995
|
|
Virus
|
HTLV1 |
|
Gene Type
|
protein-coding |
|
HPA Location Info
|
Vesicles; 
|
|
Membrane Info
|
Disease related genes, Human disease related genes, Plasma proteins, Potential drug targets, Predicted intracellular proteins, Predicted membrane proteins, Transporters |
|
Uniport_ID
|
Q14643
|
|
HGNC ID
|
HGNC:6180
|
|
OMIM ID
|
147265 |
|
Summary
|
This gene encodes an intracellular receptor for inositol 1,4,5-trisphosphate. Upon stimulation by inositol 1,4,5-trisphosphate, this receptor mediates calcium release from the endoplasmic reticulum. Mutations in this gene cause spinocerebellar ataxia type 15, a disease associated with an heterogeneous group of cerebellar disorders. Multiple transcript variants have been identified for this gene. [provided by RefSeq, Nov 2009] |
Target gene [ITPR1] related to VISs 
Integration Table: if previous studies reported that target gene was altered by virus integration events, the overlap between VISs in this literature and Cistrome factors was listed in this section
Target gene [ITPR1] related to Omics data
| Data ID |
Experiment type |
Sample number |
Platform |
|
GSE189602
|
Methylation profiling (Array) |
4 |
Infinium MethylationEPIC |
|
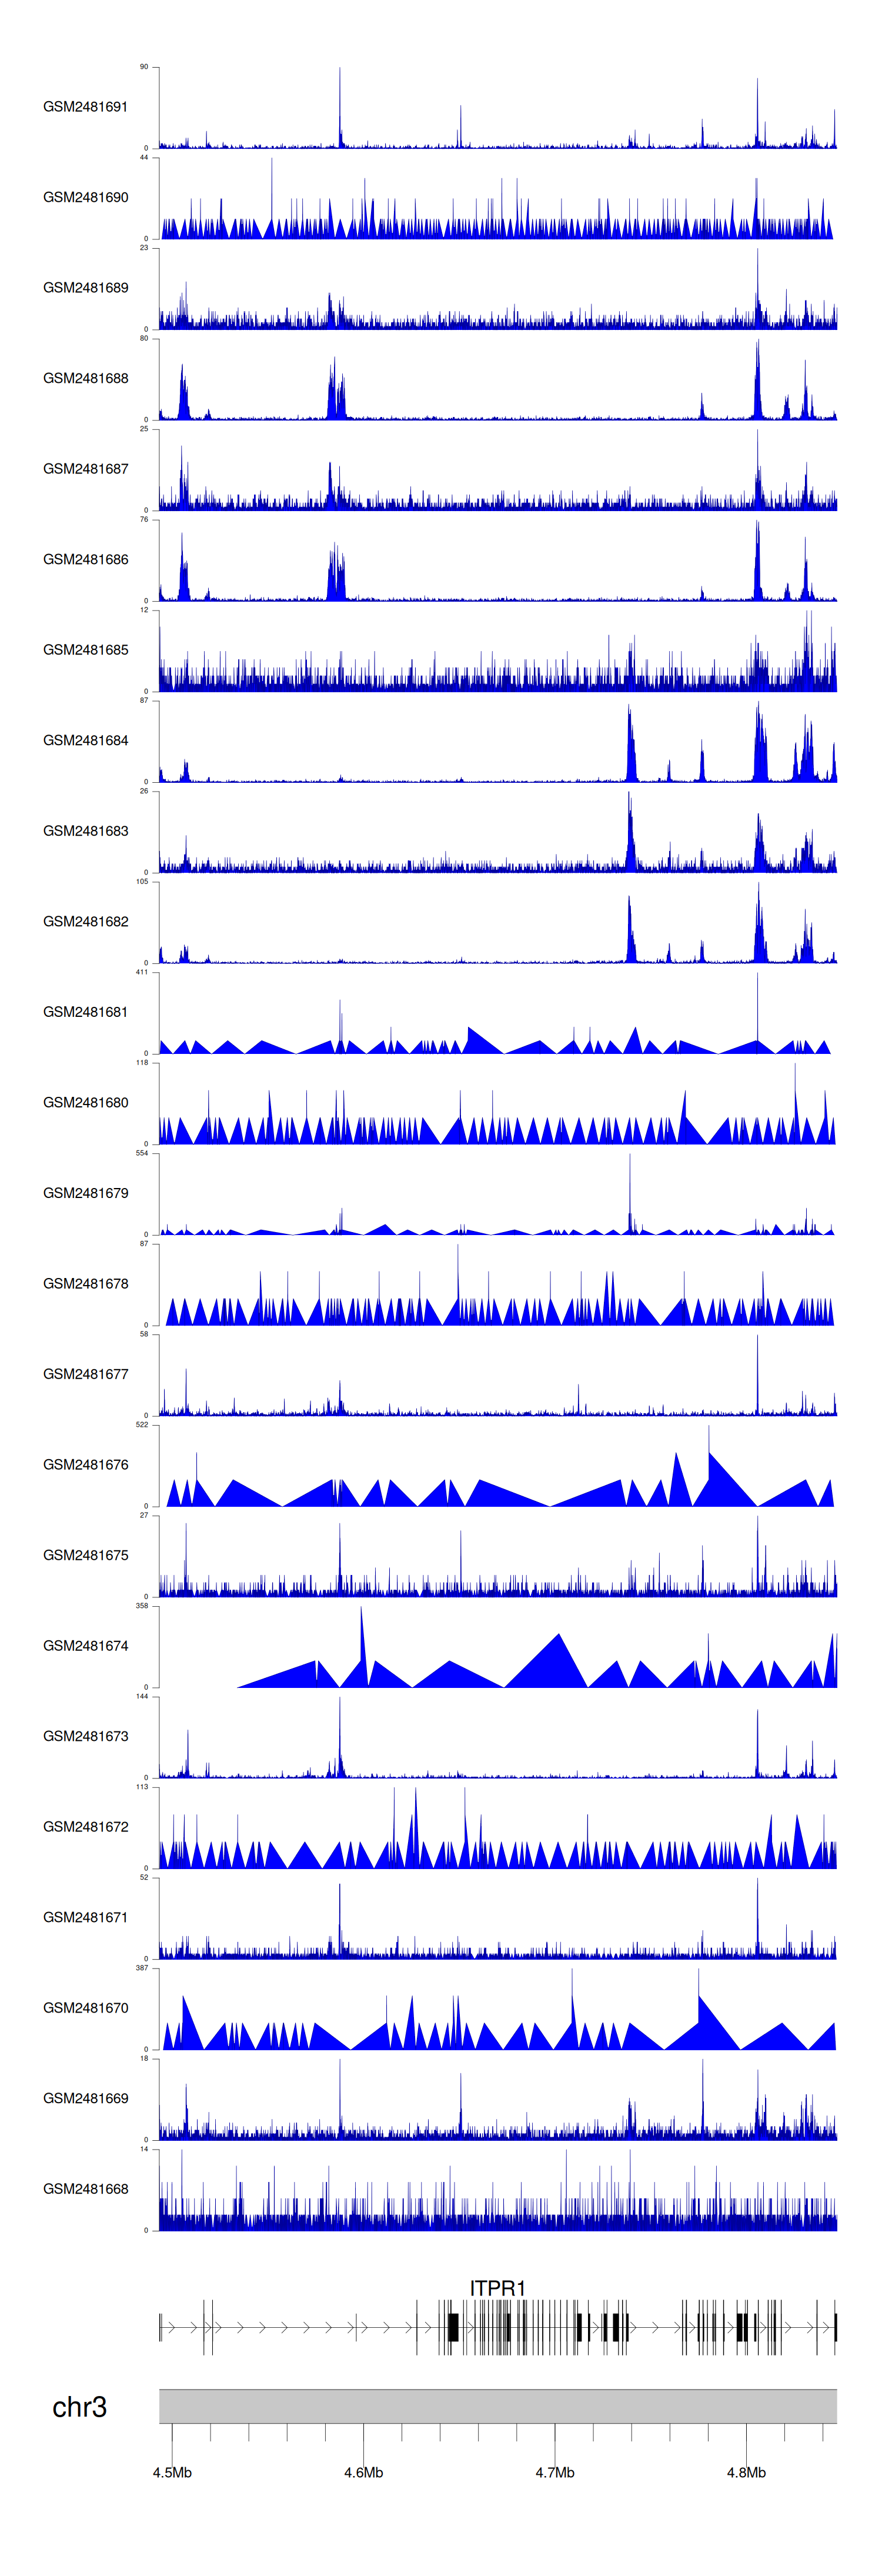
C GSE94732
|
Chip-seq |
24 |
Illumina NextSeq 500 (Homo sapiens);illumina Genome Analyzer IIx (Homo sapiens) |
|
GSE52244
|
Expression array |
15 |
[HuEx-1_0-st] Affymetrix Human Exon 1.0 ST Array [probe set (exon) version] |
|
GSE10789
|
Expression array |
6 |
NCI/ATC Hs-OperonV3 |
|
GSE224047
|
RNA-seq |
10 |
Illumina NextSeq 500 (Homo sapiens) |
|
GSE168557
|
Expression array |
6 |
Agilent-039494 SurePrint G3 Human GE v2 8x60K Microarray 039381 (Feature Number version) |
|
GSE136189
|
Methylation profiling (Array) |
40 |
Illumina HumanMethylation450 BeadChip (HumanMethylation450_15017482);Illumina Infinium HumanMethylation850 BeadChip |
When the gene can detect a peak in the dataset, a peak plot will be displayed.
> Dataset: GSE94732 - ITPR1 peak across samples
|
Peak Plot
|
|
|
