Gene Information
|
Gene Name
|
KCNH8 |
|
Gene ID
|
131096
|
|
Gene Full Name
|
potassium voltage-gated channel subfamily H member 8 |
|
Gene Alias
|
ELK|ELK1|Kv12.1|elk3|hElk-1 |
|
Transcripts
|
ENSG00000183960
|
|
Virus
|
HTLV1 |
|
Gene Type
|
protein-coding |
|
HPA Location Info
|
Plasma membrane; 
|
|
Membrane Info
|
Predicted membrane proteins, Voltage-gated ion channels |
|
Uniport_ID
|
Q96L42
|
|
HGNC ID
|
HGNC:18864
|
|
OMIM ID
|
608260 |
|
Summary
|
Voltage-gated potassium (Kv) channels represent the most complex class of voltage-gated ion channels from both functional and structural standpoints. Their diverse functions include regulating neurotransmitter release, heart rate, insulin secretion, neuronal excitability, epithelial electrolyte transport, smooth muscle contraction, and cell volume. This gene encodes a member of the potassium channel, voltage-gated, subfamily H. This member is a pore-forming (alpha) subunit. [provided by RefSeq, Jul 2008] |
Target gene [KCNH8] related to VISs 
Integration Table: if previous studies reported that target gene was altered by virus integration events, the overlap between VISs in this literature and Cistrome factors was listed in this section
| DVID |
Chromosome |
HM |
TFBS |
CA |
Sum of Overlapped Records |
Detail |
| 6005169 |
chr3 |
21 |
21 |
52 |
94 |
View |
| 6022846 |
chr3 |
1 |
3 |
0 |
4 |
View |
Target gene [KCNH8] related to Omics data
| Data ID |
Experiment type |
Sample number |
Platform |
|
GSE189602
|
Methylation profiling (Array) |
4 |
Infinium MethylationEPIC |
|
C GSE94732
|
Chip-seq |
24 |
Illumina NextSeq 500 (Homo sapiens);illumina Genome Analyzer IIx (Homo sapiens) |
|
GSE52244
|
Expression array |
15 |
[HuEx-1_0-st] Affymetrix Human Exon 1.0 ST Array [probe set (exon) version] |
|
GSE224047
|
RNA-seq |
10 |
Illumina NextSeq 500 (Homo sapiens) |
|
GSE168557
|
Expression array |
6 |
Agilent-039494 SurePrint G3 Human GE v2 8x60K Microarray 039381 (Feature Number version) |
|
GSE136189
|
Methylation profiling (Array) |
40 |
Illumina HumanMethylation450 BeadChip (HumanMethylation450_15017482);Illumina Infinium HumanMethylation850 BeadChip |
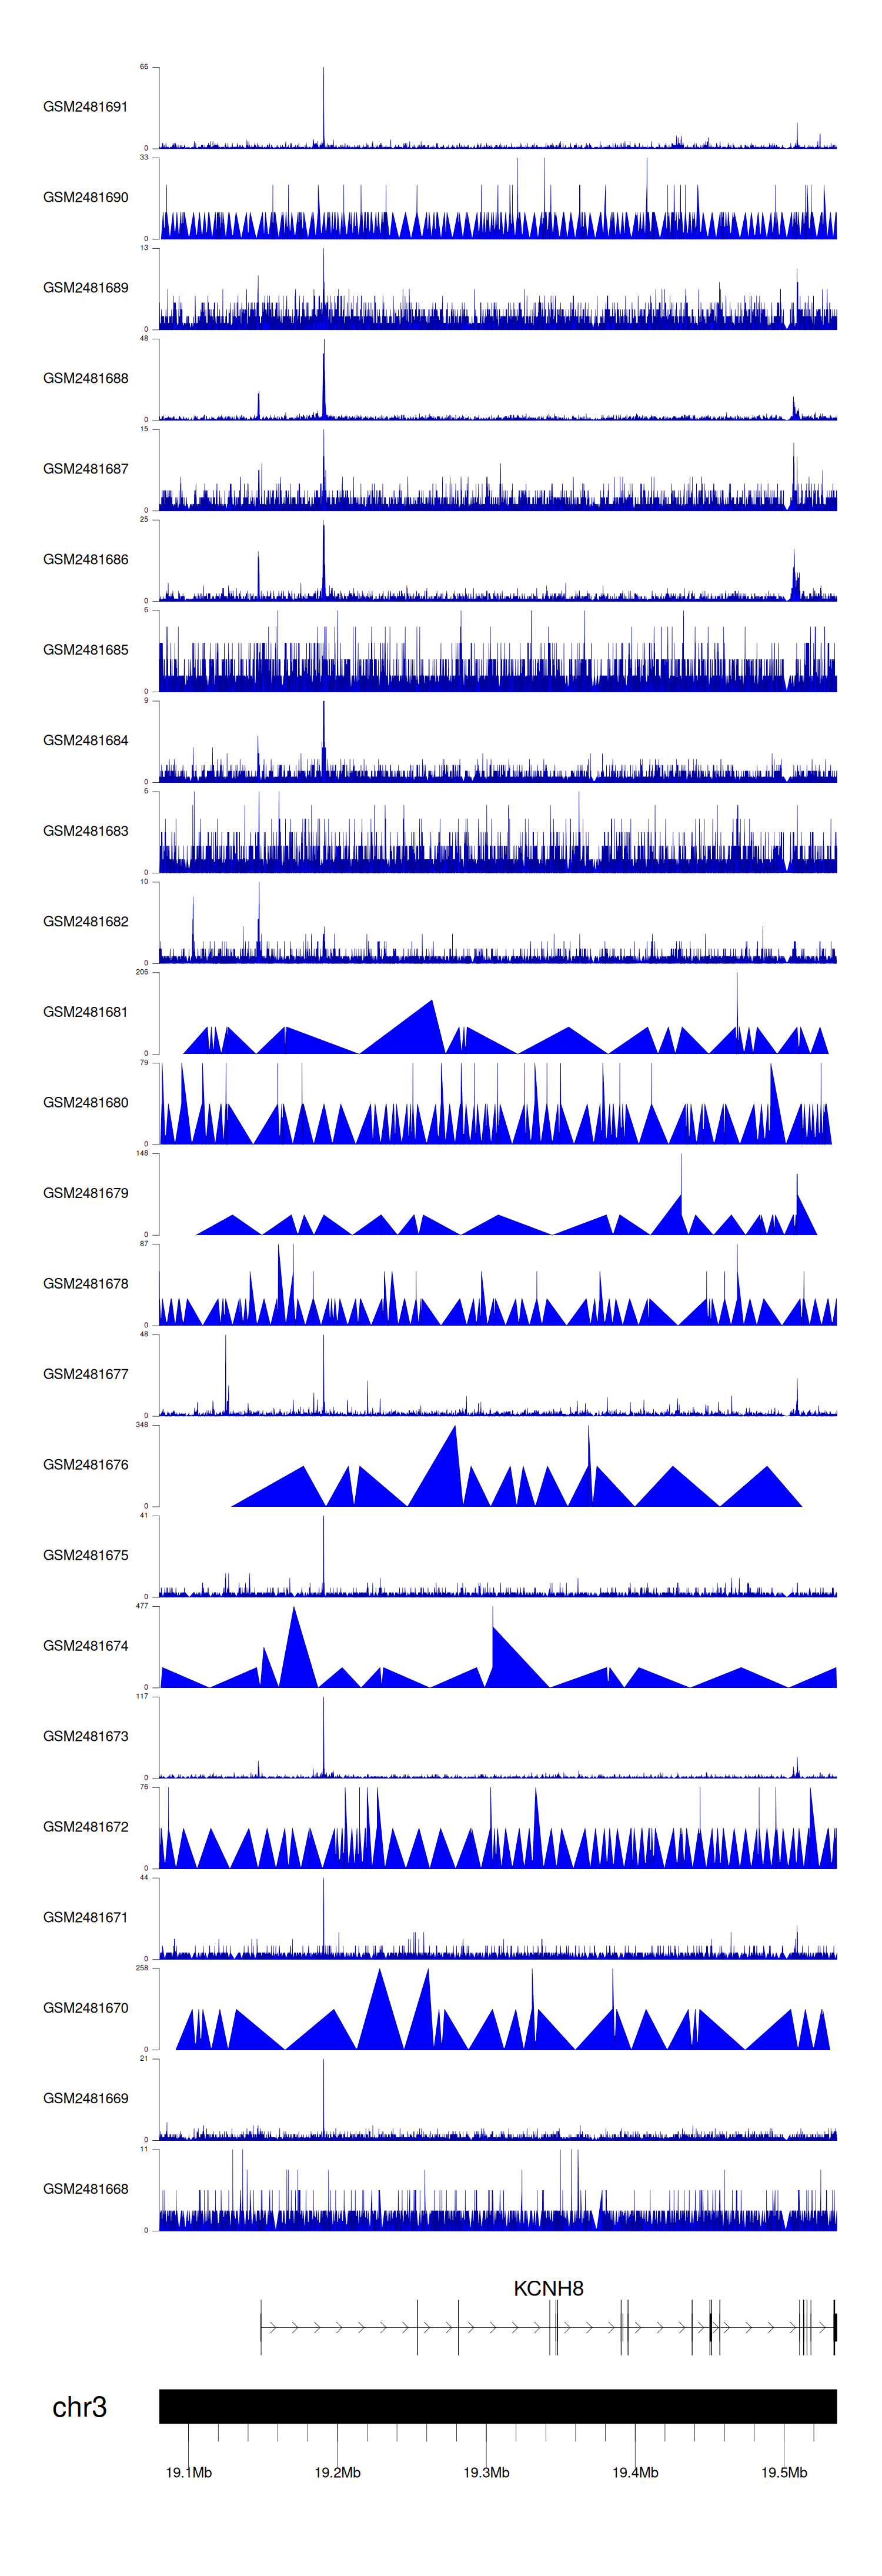
When the gene can detect a peak in the dataset, a peak plot will be displayed.
> Dataset: GSE94732 - KCNH8 peak across samples
|
Peak Plot
|
|
|
